Download
1 / 66
710 likes | 1.01k Views
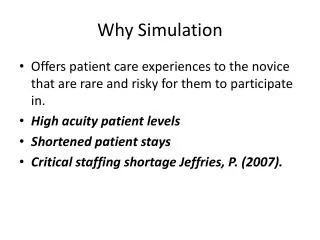
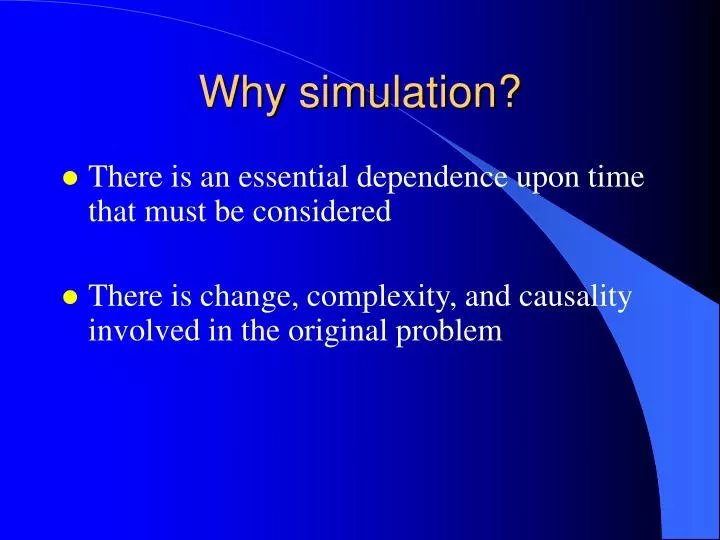
Why simulation?. There is an essential dependence upon time that must be considered There is change, complexity, and causality involved in the original problem. Simulation vs optimization. with Simulation, the question is usually “What if” This is called the “descriptive mode”

E N D
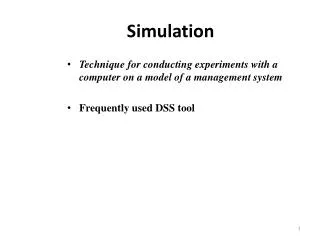
Why simulation? • There is an essential dependence upon time that must be considered • There is change, complexity, and causality involved in the original problem
Simulation vs optimization • with Simulation, the question is usually “What if” • This is called the “descriptive mode” • with optimization (math programming, decision theory) the question is “What’s best” • This is called the “prescriptive mode”
Purposes of Simulation • To explore alternatives • To improve the quality of decision making • To enable more effective planning • To improve understanding of the business • To enable faster decision making • To provide more timely information • To enable more accurate forecasts • To generate cost savings
Simulation Usage • One of the most widely used model paradigms in all of management science
Simulation gestalts Discrete versus continuous Stochastic versus deterministic Steady state versus transient Mathematical versus physical Causal versus correlative
Continuous-deterministic simulation • Forrester’s system dynamics • Fits well for large scale models where variables assume large values, taken in relation to the change in value of those variables • Many public-sector problems are best modeled with this type of approach • Problems involving energy, resources, water, pollution, food, the economy, population • Can be used to find leverage points where just a little twiking will move the entire system in the right direction
Methodological Overview • Collect information and sources thereof--books, articles, internet, PEOPLE • Construct causal models representing what the written material would suggest is causally correct • Use knowledgeable people to refine and validate these models • Transform these causal models into schematic models • Use VENSIM, STELLA, or POWERSIM to implement the schematic model and execute the associated simulation
Discrete-stochastic simulation • Pritsker/Kiviat were initial developers • Most BPR simulators are of this variety • Fits well where probabilistic considerations come into play significantly • variables are largely binary or at least their values are small taken in relation to their change
Overview of system dynamics and its sister, Systems Thinking • World wide push to inculcate systems thinking into K-16 education • Andersen teaches it to all of their consultants and sees it as the next major wave in consulting • Peter Senge is Forrester’s student
Systems Thinking basics • Peruse relevant literature • Talk to people knowledgeable about the problem • List relevant variables • Describe causal interactions between variables • Fully delineate the causal diagram • Draw behavior over time graphs
Examples • Itch--scratch • population and growth rate of population • revenues, sales force size, sales • inventory, order rate, desired inventory,
Definitions and Terms • ST--Systems Thinking • SD--Systems Dynamics • CLD--Causal Loop Diagram • BOT--Behavior Over Time Chart • SFD--Stock & Flow Diagram • Also called Forrester Schematic, or simply “Flow Diagram” • quantity--any variable, parameter, constant, or output • edge--a causal link between quantities
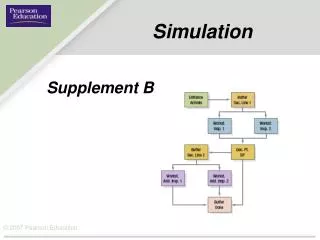
Stock and Flow Notation--Quantities • STOCK • RATE • Auxiliary
Stock and Flow Notation--Quantities • Input/Parameter/Lookup • Have no edges directed toward them • Output • Have no edges directed away from them
Inputs and Outputs • Inputs • Parameters • Lookups • Outputs
Stock and Flow Notation--edges • Information • Flow
Some rules relative to causal diagrams • There are two types of causal links in causal models • Information • Flow • Information proceeds from stocks and parameters/inputs toward rates where it is used to control flows • Flow edges proceed from rates to states (stocks) in the causal diagram always
Robust Loops • In any loop involving a pair of quantities/edges, • one quantity must be a rate • the other a state or stock, • one edge must be a flow edge • the other an information edge
CONSISTENCY • All of the edges directed toward a quantity are of the same type • All of the edges directed away from a quantity are of the same type
STEP 1: Identify parameters • Parameters have no edges directed toward them
STEP 2: Identify the edges directed from parameters • These are information edges always
STEP 3: By consistency identify as many other edge types as you can
STEP 4: Look for loops involving a pair of quantities only • Use the rules for robust loops identified above
Distinguishing Stocks & Flows by Name NAME UNITS Stock or flow Revenue Liabilities Employees Depreciation Construction starts Hiring material standard of living
System Dynamics Software • STELLA and I think • High Performance Systems, Inc. • best fit for K-12 education • Vensim • Ventana systems, Inc. • Free from downloading off their web site: www.vensim.com • Robust--including parametric data fitting and optimization • best fit for higher education • Powersim • What Arthur Andersen is using
What is system dynamics • A way to characterize systems as stocks and flows between stocks • Stocks are variables that accumulate the affects of other variables • Rates are variables the control the flows of material into and out of stocks • Auxiliaries are variables the modify information as it is passed from stocks to rates
A Simple Methodology • Collect info on the problem • List variables on post-it notes • Describe causality using a CLD • Translate CLD into SFD • Enter into VENSIM • Perform sensitivity and validation studies • Perform policy and WHAT IF experiments • Write recommendations
Causal Modeling • A way to characterize the physics of the system • Lacking: a Newton to describe the causality in these socioeconomic systems
A single-sector exponential growth model • Einstein said the most powerful force in the world was compound interest • interest taken in relation to principal • Each stock requires an initial value
Let’s DO IT • Create the stock principal • Include the rate interest • Include the information connector • Initialize the stock • Simulate
John vs. Jack • Each works for 30 years before retiring • John makes $2000 contributions to his IRA each year for the first five years and none there after. • Jack makes $2000 contributions to his IRA each year beginning in year six and continuing through year 30 • Each IRA yields a 15% compounded return • Which turns out to be larger?
A single-sector Exponential growth Model Consider a simple population with infinite resources--food, water, air, etc. Given, mortality information in terms of birth and death rates, what is this population likely to grow to by a certain time?
Key Benefits of the ST/SD • A deeper level of learning • Far better than a mere verbal description • A clear structural representation of the problem or process • A way to extract the behavioral implications from the structure and data • A “hands on” tool on which to conduct WHAT IF
Senge’s Five Disciplines • Personal Mastery • because we need to be the very best we can be • Mental Models • because these are the basis of all decision-making • Shared Vision • because this galvanizes workers to pursue a common goal • Team Learning • because companies are organized into teams • Systems Thinking • because this is only tool for coping with complexity
Relating behaviors to structures • Reinforcing loops create exponential growth • Balancing loops create exponential goal-seeking or decay
The VENSIM User Interface • The Time bounds Dialog box
Exponentially growing population model • In 1900 there were just 1.65 billion people on the planet. Today, there are more than 6 billion people on the planet. Every year there are .04 births per capita and .028 deaths per capita. • The .04 births per capita shall be referred to as a parameter called BIRTH RATE NORMAL