Download
1 / 2
20 likes | 160 Views
ZnK 1. CuK 1. NiK 1 RbK 1(II). CuK 1. NiK 1. Analitical Center. Institute of the Earth ’s Crust, Irkutsk, Russia. X-RAY FLUORESCENCE DETERMINATION OF Ti, V, Ni, Zn, Ba, La, Ce AND Nd IN VARIOUS TYPES OF ROCKS. Table 1. Analytical conditions.

E N D
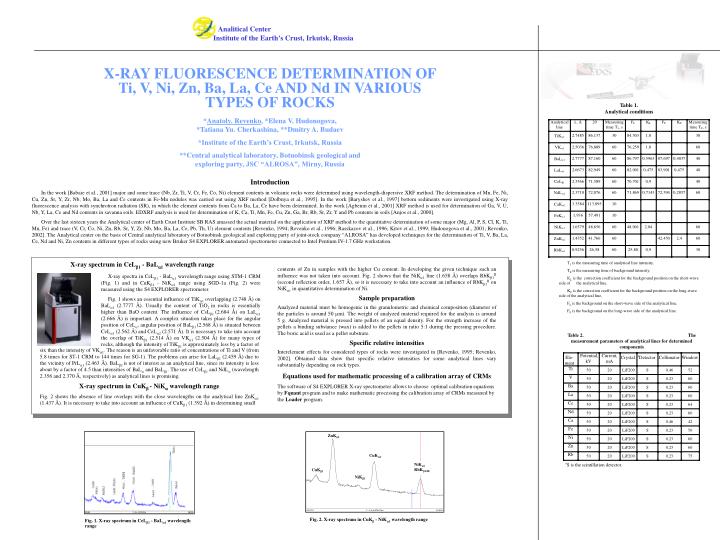
ZnK1 CuK1 NiK1 RbK1(II) CuK1 NiK1 Analitical Center Institute of the Earth’s Crust, Irkutsk, Russia X-RAY FLUORESCENCE DETERMINATION OF Ti, V, Ni, Zn, Ba, La, Ce AND Nd IN VARIOUS TYPES OF ROCKS Table 1. Analytical conditions *Anatoly. Revenko, *Elena V. Hudonogova, *Tatiana Yu. Cherkashina, **Dmitry A. Budaev *Institute of the Earth’s Crust, Irkutsk, Russia **Central analytical laboratory, Botuobinsk geological and exploring party, JSC “ALROSA”, Mirny, Russia Introduction In the work [Babaie et al., 2001] major and some trace (Nb, Zr, Ti, V, Cr, Fe, Co, Ni) element contents in volcanic rocks were determined using wavelength-dispersive XRF method. The determination of Mn, Fe, Ni, Cu, Zn, Sr, Y, Zr, Nb, Mo, Ba, La and Ce contents in Fe-Mn nodules was carried out using XRF method [Dolbnya et al., 1995]. In the work [Baryshev et al., 1997] bottom sediments were investigated using X-ray fluorescence analysis with synchrotron radiation (SR), in which the element contents from Ca to Ba, La, Ce have been determined. In the work [Agbenin et al., 2001] XRF method is used for determination of Ga, V, U, Nb, Y, La, Ce and Nd contents in savanna soils. EDXRF analysis is used for determination of K, Ca, Ti, Mn, Fe, Cu, Zn, Ga, Br, Rb, Sr, Zr, Y and Pb contents in soils [Anjos et al., 2000]. Over the last sixteen years the Analytical center of Earth Crust Institute SB RAS amassed the actual material on the application of XRF method to the quantitative determination of some major (Mg, Al, P, S, Cl, K, Ti, Mn, Fe) and trace (V, Cr, Co, Ni, Zn, Rb, Sr, Y, Zr, Nb, Mo, Ba, La, Ce, Pb, Th, U) element contents [Revenko, 1994; Revenko et al., 1996; Rasskazov et al., 1996;Kitov et al., 1999; Hudonogova et al., 2001; Revenko, 2002]. The Analytical center on the basis of Central analytical laboratory of Botuobinsk geological and exploring party of joint-stock company “ALROSA” has developed techniques for the determination of Ti, V, Ba, La, Ce, Nd and Ni, Zn contents in different types of rocks using new Bruker S4 EXPLORER automated spectrometer connected to Intel Pentium IV-1.7 GHz workstation. X-ray spectrum in CeL1 - BaL1 wavelength range Т1 is the measuring time of analytical line intensity, TF is the measuring time of background intensity, КL is the correction coefficient for the background position on the short-wave side of the analytical line, KP is the correction coefficient for the background position on the long-wave side of the analytical line, FL is the background on the short-wave side of the analytical line, FP is the background on the long-wave side of the analytical line. contents of Zn in samples with the higher Cu content. In developing the given technique such an influence was not taken into account. Fig. 2 shows that the NiK1 line (1.658 Å) overlaps RbK1II (second reflection order, 1.657 Å), so it is necessary to take into account an influence of RbK1II on NiK1 in quantitative determination of Ni. Sample preparation Analyzed material must be homogenic in the granulometric and chemical composition (diameter of the particles is around 50 m). The weight of analyzed material required for the analysis is around 5 g. Analyzed material is pressed into pellets of an equal density. For the strength increase of the pellets a binding substance (wax) is added to the pellets in ratio 5:1 during the pressing procedure. The boric acid is used as a pellet substrate. Specific relative intensities Interelement effects for considered types of rocks were investigated in [Revenko, 1995; Revenko, 2002]. Obtained data show that specific relative intensities for some analytical lines vary substantially depending on rock types. Equations used for mathematic processing of a calibration array of CRMs The software of S4 EXPLORER X-ray spectrometer allows to choose optimal calibration equations by Fquant program and to make mathematic processing the calibration array of CRMs measured by the Loader program. X-ray spectra in CeL1 - BaL1 wavelength range using STM-1 CRM (Fig. 1) and in CuK1 - NiK1 range using SGD-1a (Fig. 2) were measured using the S4 EXPLORER spectrometer. Fig. 1 shows an essential influence of TiK1 overlapping (2.748 Å) on BaL1 (2.7777 Å). Usually the content of TiO2 in rocks is essentially higher than BaO content. The influence of CsLβ1 (2.684 Å) on LaL1(2.666 Å) is important. A complex situation takes place for the angular position of CeL, angular position of BaLβ1 (2.568 Å) is situated between CeL1 (2.562 Å) and CeL2 (2.571 Å). It is necessary to take into account the overlap of TiK1 (2.514 Å) on VK1 (2.504 Å) for many types of rocks, although the intensity of TiK1 is approximately less by a factor of Table 2. The measurement parameters of analytical lines for determined components six than the intensity of VK1. The reason is an unfavorable ratio of concentrations of Ti and V (from 5.8 times for SТ-1 CRM to 144 times for SG-1). The problems can arise forLaLβ1 (2.459 Å) due to the vicinity of PrL1 (2.463 Å). BaLβ2 is not of interest as an analytical line, since its intensity is less about by a factor of 4.5 than intensities of BaL and BaLβ1. The use of CeLβ1 and NdL (wavelength 2.356 and 2.370 Å, respectively) as analytical lines is promising. X-ray spectrum in CuK- NiK wavelength range Fig. 2 shows the absence of line overlaps with the close wavelengths on the analytical line ZnK1 (1.437 Å). It is necessary to take into account an influence of CuK1 (1.392 Å) in determining small Fig. 2. X-ray spectrum in CuK - NiK1 wavelength range Fig. 1. X-ray spectrum in CeL1 - BaL1 wavelength range
Table 3. Specific relative intensities Irel of analytical lines for CRMs of rock (Rh-аnode, 40 kV, d0 = 250 m Be, SGD-1A reference sample) The basic calibration equation is as follows: , (1) where Ciи Ii are concentration and pure intensity of calibrating element; miis the slope of calibration plot; Ijis the pure intensity of matrix elements. In calibrating the equations by least square method (LSM) the absolute quadratic deviation was used as the minimization parameter: , (2) where · is the chemical concentration of CRM n; · is the calculated concentration. CRM contents were taken from [Lontsikh, Petrov, 1998; Govindaraju, 1994]. CRMs used for the calibration of each analytical line and line overlaps, which were taken into account, are presented in Table. The coefficients for an accounting of line overlaps, which are close in energies to the determined element line energy, are calculated with Fquant program using the equation: , (3) where · is the pure intensity of line of determined element; · is the intensity of an interfering line (calculated or measured); · is the regression coefficient. It is possible to use mixed correction consisting of several types. The accounting of matrix effects in the FQuant program is realized using method of-coefficients in the following equation: (4) In this case the coefficients are fixed and calculated by using the regression. The ranges of analyzed contents (in %). TiO2 - 0.004-1.85, Ce - 0.0006-0.015, V - 0.0006-0.032, Nd - 0.001-0.007, Ba - 0.004-0.225, Rb – 0.0011-0.15. La - 0.0006-0.008, Zn – 0.0024-0.2, Ni – 0.0005-0.13 Metrological characteristics for the determination Ti, V, Ba, La, Ce, Nd, Ni, Zn contents Note: calc is the root-mean-square deviation of relative error (experimentally obtaned); z is the reserve of accuracy; z was calculated using the equation: , where is the allowable relative root-mean-square deviation of the error of analysis results. CONCLUSION The technique was integrated into the analytical practice of Central analytical laboratory of Botuobinsk geological and exploring party of joint-stock company “ALROSA” in May 2003. The work is supported by RFBR, grant No 04-07-90227, grant No 104 SB RAS. REFERENCES 8. Revenko A.G., Petrova G.P., Tkov A.V., Yasnigina T.A. The use of X-rays in science and technics. Irkutsk: ISU, 1996; 58-68. 9. Revenko A.G.X-Ray spectral fluorescence analysis of natural materials. Novosibirsk: Nauka, 1994; 264. 10. Kitov B.I., Revenko A.G., Yasnigina T.A., Panteeva S.V., Cherkashina T.Yu. Analitika i kontrol. 1999; 3:16-20. 11. Revenko A.G. X-Ray Spectrom. 2002; 31 (3): 264-273. 12. Revenko A.G. Analitika i kontrol.2002; 6 (3): 231-246. 13. Revenko A.G. X-ray spectral fluorescence analysis of natural materials: Abstract of doctor’s thesis - М., 1995. - 48 с. 14. Lontsikh S.V., Petrov L.L. CRMs of the natural environment content. Novossibirsk: Nauka, 1988; 277. 15. Govindaraju K. Geostandards Newsletter: Special Issue, 1994; 18: 158. 16. International standard. ISO 5725, 2000; 96. 1. Babaie H.A., Ghari A.M., Babaie A., T.E. La Tour, Hassanipak A.A. J. of Asian Earth Sciences. 2001; 19: 61-76. 2. Dolbnya I.P., Golubev A.V., Zolotarev K.V., Bobrov V.A., Kalugin I.A.Nuclear Instruments and Methods in Physics Research A. 1995; 359: 327-330. 3. Baryshev V.B., Golubev A.V., Dvurechenskaya S. Ya., Sokolovskaya I.P., Trunova V.A.Nuclear Instruments and Methods in Physics ResearchA. 1995; 359: 305-306. 4. Agbenin J.O., P. Felix-Henningsen.The Science of the Total Environment. 2001; 277: 57-68. 5. M.J. dos Anjos, R.T. Lopes, E.F.O. de Jesus, J.T. Assis, R. Cesareo, C.A.A. Barradas. Spectr. Acta Part B. 2000; 55: 1189-1194. 6. Rasskazov S.V., Revenko A.G., Petrova G.P., Ivanov A.V. Earth crust: Irkutsk, 1996; 81-83. 7. Hudonogova E.V., Cherkashina T.Yu., Revenko A.G. Analitica I kontrol. 2001; 5 (4): 409-416.