Download
1 / 32
320 likes | 457 Views
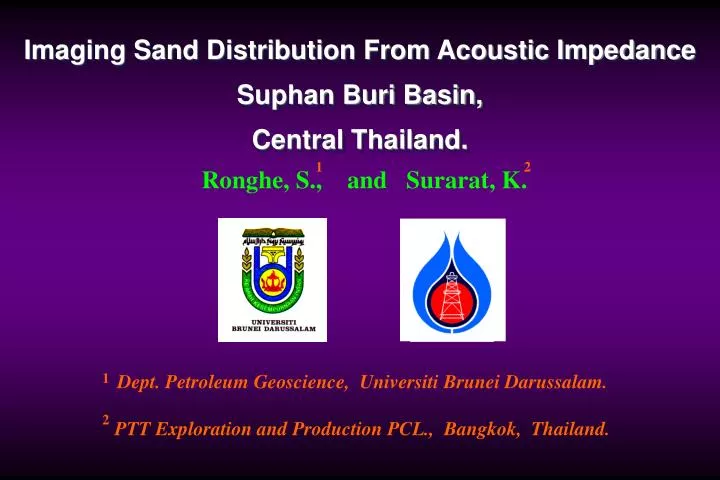
Imaging Sand Distribution From Acoustic Impedance Suphan Buri Basin, Central Thailand. 1. 2. Ronghe, S., and Surarat, K. 1. Dept. Petroleum Geoscience, Universiti Brunei Darussalam. PTT Exploration and Production PCL., Bangkok, Thailand. 2. CONTENTS. Study objectives

E N D
Imaging Sand Distribution From Acoustic Impedance Suphan Buri Basin, Central Thailand. 1 2 Ronghe, S., and Surarat, K. 1 Dept. Petroleum Geoscience, Universiti Brunei Darussalam. PTT Exploration and Production PCL., Bangkok, Thailand. 2
CONTENTS • Study objectives • Location and geology • Wireline analysis • Well to seismic correlation • Seismic attribute analysis • Inverse modeling • Results and interpretation • Conclusions • Acknowledgements
STUDY OBJECTIVES • To determine the potential of wireline and seismic • as a discriminator of formation lithology / fluid. • To apply the seismic inversion to image depositional • succession
N STUDY LOCATION Phitsanulok Basin THAILAND Mae Ping Fault Zone Sing Buri Basin Suphan Buri Basin STUDY AREA Ayuthaya Basin Kamphaeng Saen Basin Sala Daeng Basin Three Pagodas Fault Zone BANGKOK 30 km Adapted from O’Leary and Hill (1989)
Schematic stratigraphic sequence, Suphan Buri Basin Age Unit Depth Depositional system Lithology Petroleum system 500 - m Sands, gravels, siltstone & mudstone, fluvial origin E Alluvial - Fluvial Pliocene - Recent U D1 Fluvio-lacustrine sandstone, siltstone interbedded with mudstone. D2 1000 - D3 Reservoirs Upper D4 D D5 Fluvial channel sandstone and conglomeratic sandstone. D6 Fluvio- lacustrine Miocene Source and Reservoirs Mid D7 U C1 1500 - Intercalated sandstone, siltstone & mudstone. Lacustrine system with fluvial influence. C2 C Lower C3 Source C4 B Lacustrine Mudstone with minor siltstone. Source Oligocene Early basin fill Alluvial - lacustrine Conglomerate, sandstone interbedded with siltstone and minor mudstone. Source and Reservoirs 2000 - A Basement complex: clastics, carbonate rocks or metasediments. Pre Tertiary Adapted from Intharawijitr (1993)
TWT STRUCTURAL MAP UT1-7/D2 UT1-7 UT1-3/D1 UT1-3 N 1 Km Time (ms) Horizon D3 Time structure map 560 630 700 770 840 910 980 1059 Area = 37 sq. km.
Well UT1-7 Well UT1-3 GR AI GR AI Sub-unit D1 Sub-unit D2 Wireline cross-plots Above OWC m TVD Sub-unit D3 m TVD OWC OWC Sub-unit D4 Wireline cross-plots Below OWC Sub-unit D5 Sub-unit D6
CONTENTS • Study objectives • Location and geology • Wireline analysis • Well to seismic correlation • Seismic attribute analysis • Inverse modeling • Results and interpretation • Conclusions • Acknowledgements
Wireline cross-plot: Below OWC UT1-3 High AI GR Shale Gamma ray (API) Shaly-sand Sand Low Impedance (g/cc * m/s)
Wireline cross-plot: Below OWC UT1-3 LLD GR Gamma ray (API) Resistivity (ohm / m)
Wireline cross-plot: Above OWC UT1-7 High AI GR Shale Gamma ray (API) Shaly-sand Sand Low Impedance (g/cc * m/s)
Wireline cross-plot: Above OWC UT1-7 LLD GR Gamma ray (API) Resistivity (ohm / m)
WELL TO SEISMIC CORRELATION Seismic Synthetic Impedance (g/cc*m/s) Synthetic Wavelet
CONTENTS • Study objectives • Location and geology • Wireline analysis • Well to seismic correlation • Seismic attribute analysis • Inverse modeling • Results and interpretation • Conclusions • Acknowledgements
SEISMIC ATTRIBUTE ANALYSIS 126 OWC -126
SEISMIC ATTRIBUTE ANALYSIS High OWC Low
Well UT1-7 Well UT1-3 GR AI GR AI Sub-unit D1 Sub-unit D2 Wireline cross-plots Above OWC m TVD Sub-unit D3 m TVD OWC OWC Sub-unit D4 Wireline cross-plots Below OWC Sub-unit D5 Sub-unit D6
CONTENTS • Study objectives • Location and geology • Wireline analysis • Well to seismic correlation • Seismic attribute analysis • Inverse modeling • Results and interpretation • Conclusions • Acknowledgements
INVERSE MODELLING FLOWCHART WAVELETS SEISMIC LOGS TOPS HORIZONS FAULTS AI Constraints AI Interpolation Solid earth model CSSI AI model Impedance (mid frequency) Impedance (low frequency) Trace merge Final AI result
IMPEDANCE TREND AND CONSTRAINTS Well SK-1 Trend Constraints AI log
INVERSE MODELING RESULT High Low
18m 12m 20m INVERSE MODELING RESULT
Impedance (g/cc * m/s) Sub-unit D6 Sub-unit D5 Impedance (g/cc * m/s) 10000 Maximum impedance distribution Maximum impedance distribution 9500 10500 10000 11000 10500 11500 11000 12000 11500 12500 SAND 12000 UT1-7/D2 UT1-7/D2 13000 SAND 12500 UT1-7 UT1-7 13500 13000 UT1-3/D1 UT1-3/D1 UT1-3 UT1-3 13500 N N 1 Km 1 Km
Sub-unit D3 Sub-unit D4 Impedance (g/cc * m/s) Impedance (g/cc * m/s) Maximum impedance distribution Maximum impedance distribution 9000 9000 9500 9500 10000 10000 10500 10500 11000 11000 11500 11500 UT1-7/D2 UT1-7/D2 SAND SAND 12000 UT1-7 UT1-7 12000 UT1-3/D1 UT1-3/D1 12500 12500 UT1-3 UT1-3 13000 13000 N N 1 Km 1 Km
Generalized rift structure and sedimentation patterns DELTAIC / FLUVIAL Sandstone + mudstone Fan in footwall transfer zone ALLUVIAL FAN / FAN DELTA Conglomerate + sandstone (Modified from Leeder and Gawthorpe 1987)
Sub-unit D5 Sub-unit D6 LEGEND Impedance Interpretation Impedance Interpretation Shale Sand Transport direction Fan / slump Delta lobe Feeder canyon FS FC FS FS DL FS FC N N DL DL 1 Km 1 Km
BF Sub-unit D4 Sub-unit D3 BF LEGEND Impedance Interpretation Impedance Interpretation Shale Sand Transport direction Fan / slump Delta lobe Channel Basinfloor fan C FC C FS DL FS FS C BF N N DL DL 1 Km 1 Km
SUMMARY GEOLOGICAL MODEL OF THE STUDY AREA Fault linkage Remnant relay ramp Minimum displ. Maximum displacement Maximum displacement Fan or slump Feeder canyons Axial delta lobe Axial channel 0 1.5 Basinfloor fans Km N
CONCLUSIONS (1) • Wireline impedance and seismic attributes responded primarily • to lithology. • Inverse modeling resulted in good comparison between • wireline impedance and adjacent derived impedance traces, • and enabled vertical sand resolution of about 12 m. • Maximum impedance extractions imaged two styles of sand • distribution: axial and boundary fault induced deposits.
CONCLUSIONS (2) • Axial deposits (delta lobes, channels and basinfloor fans) • prograded from south to north downdip into the basin. • Boundary fault induced deposits (fans / slumps and feeder canyons) • showed two component pathways: • Fans / slumps were transported perpendicular to the fault. • Feeder canyons transported sediment downslope to the NE. • The basin architecture and sedimentation patterns agree with • published general models of rift geology.
ACKNOWLEDGEMENTS • PTT Exploration and Production Public Co. Ltd. • for data & permission to present the results. • Jason Geosystems and Landmark Graphic Corp. • for software donation to the Department of • Petroleum Geoscience, UBD. • Jason Geosystems for technical support and review • of this study.
PRESENTATION OVERVIEW Acoustic impedance is used to map the locations and shapes of sand bodies deposited within a producing fluvio-lacustrine interval of a continental half graben basin.