Download
1 / 122
1.22k likes | 1.46k Views
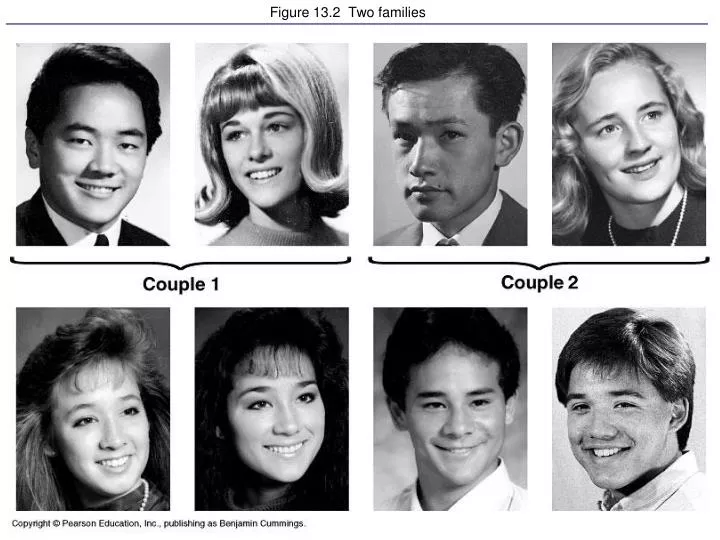
Figure 13.2 Two families. Figure 13.x1 SEM of sea urchin sperm fertilizing egg. Figure 13.x4 Human male chromosomes shown by bright field G-banding. Fig. 9-2a. Figure 14.x1 Sweet pea flowers. Figure 14.1 A genetic cross. Petal. Fig. 9-2b. Stamen. Carpel. White. Removed

E N D
Figure 13.x4 Human male chromosomes shown by bright field G-banding
Petal Fig. 9-2b Stamen Carpel
White Removed stamens from purple flower 1 Stamens Fig. 9-2c-1 Carpel Transferred pollen from stamens of white flower to carpel of purple flower 2 Parents (P) Purple
White Removed stamens from purple flower 1 Stamens Fig. 9-2c-2 Carpel Transferred pollen from stamens of white flower to carpel of purple flower 2 Parents (P) Purple Pollinated carpel matured into pod 3
White Removed stamens from purple flower 1 Stamens Fig. 9-2c-3 Carpel Transferred pollen from stamens of white flower to carpel of purple flower 2 Parents (P) Purple Pollinated carpel matured into pod 3 Planted seeds from pod 4 Offspring (F1)
Flower color Purple White Flower position Axial Terminal Fig. 9-2d Seed color Green Yellow Seed shape Wrinkled Round Pod shape Inflated Constricted Green Pod color Yellow Tall Stem length Dwarf
P generation (true-breeding parents) Purple flowers White flowers Fig. 9-3a-1
P generation (true-breeding parents) Purple flowers White flowers Fig. 9-3a-2 F1 generation All plants have purple flowers
P generation (true-breeding parents) Purple flowers White flowers Fig. 9-3a-3 F1 generation All plants have purple flowers Fertilization among F1 plants (F1´ F1) F2 generation of plants have purple flowers of plants have white flowers 1 – 4 3 – 4
Genetic makeup (alleles) P plants pp PP Gametes All All p P Fig. 9-3b F1 plants (hybrids) All Pp p P 1 – 2 1 – 2 Gametes Sperm p P P PP Pp F2 plants Phenotypic ratio 3 purple : 1 white Eggs Genotypic ratio 1 PP : 2 Pp : 1 pp Pp pp p
Gene loci Dominant allele B a P Fig. 9-4 b P a Recessive allele Bb PP Genotype: aa Homozygous for the recessive allele Heterozygous Homozygous for the dominant allele
Figure 14.2 Mendel tracked heritable characters for three generations
Table 14.1 The Results of Mendel’s F1 Crosses for Seven Characters in Pea Plants
Figure 14.7 Testing two hypotheses for segregation in a dihybrid cross
Figure 14.8 Segregation of alleles and fertilization as chance events
Figure 14.12 A simplified model for polygenic inheritance of skin color
Discussion Questions • How can a mutation be harmful in one environment and helpful in another? • Why should a mutation persist if it kills people? • Why are there more people with sickle cell disease in one part of the world than in other parts? http://www.teachersdomain.org/resource/tdc02.sci.life.gen.mutationstory/
Figure 14.15 Pleiotropic effects of the sickle-cell allele in a homozygote
Hypothesis: Independent assortment Hypothesis: Dependent assortment rryy P generation rryy RRYY RRYY ry ry Gametes RY Gametes RY Fig. 9-5a RrYy F1 generation RrYy Sperm Sperm RY 1 – 4 Ry ry 1 – 4 1 – 4 1 – 4 rY ry RY 1 – 2 1 – 2 RY 1 – 4 F2 generation RY 1 – 2 RrYy RRYY RrYY RRYy Eggs 1 – 4 rY ry 1 – 2 RrYY rrYY RrYy rrYy Eggs Yellow round 9 –– 16 Ry 1 – 4 RRYy RRyy Rryy RrYy Green round 3 –– 16 1 – 4 ry Hypothesized (not actually seen) Yellow wrinkled Rryy rrYy rryy 3 –– 16 RrYy Actual results (support hypothesis) Green wrinkled 1 –– 16
Blind Blind Fig. 9-5b Chocolate coat, normal vision bbN_ Black coat, normal vision B_N_ Black coat, blind (PRA) B_nn Phenotypes Genotypes Chocolate coat, blind (PRA) bbnn BbNn Mating of heterozygotes (black, normal vision) BbNn 9 black coat, normal vision 3 black coat, blind (PRA) 3 chocolate coat, normal vision 1 chocolate coat, blind (PRA) Phenotypic ratio of offspring