Download
1 / 8
80 likes | 232 Views
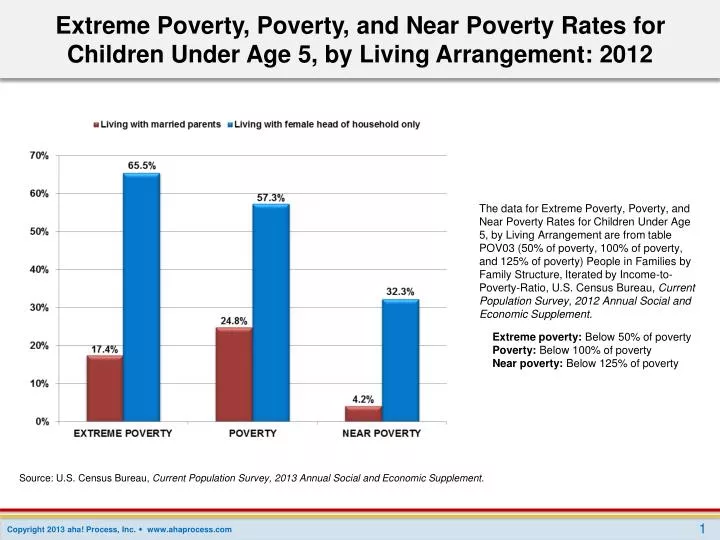
Extreme Poverty, Poverty, and Near Poverty Rates for Children Under Age 5, by Living Arrangement: 2012.

E N D
Extreme Poverty, Poverty, and Near Poverty Rates for Children Under Age 5, by Living Arrangement: 2012 The data for Extreme Poverty, Poverty, and Near Poverty Rates for Children Under Age 5, by Living Arrangement are from table POV03 (50% of poverty, 100% of poverty, and 125% of poverty) People in Families by Family Structure, Iterated by Income-to-Poverty-Ratio, U.S. Census Bureau, Current Population Survey, 2012 Annual Social and Economic Supplement. Extreme poverty: Below 50% of poverty Poverty: Below 100% of poverty Near poverty: Below 125% of poverty Source: U.S. Census Bureau, Current Population Survey, 2013 Annual Social and Economic Supplement.
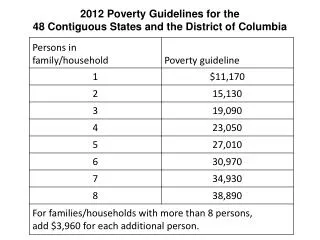
2013 Poverty Guidelines for the 48 Contiguous States and Washington D.C. Source: U.S. Department of Health and Human Services (January 2013). Federal Register, Vol. 78, No. 16, January 24, 2013, pp. 5182-5183
Household Income in 20% Increments of Total: 2012 Source: U.S. Census Bureau, Current Population Survey, 2013 Annual Social and Economic Supplement (households as of March of the following year).
Breakdown of U.S. Households, by Total Money Income: 2012 Source: U.S. Census Bureau, Current Population Survey, 2013 Annual Social and Economic Supplement (households as of March of the following year). Estimated median household income: $51,371 Source: U. S. Census Bureau, 2012 American Community Survey 1-Year Estimates.
Number and Percentage of Children in Poverty, by Race: 2012 * Hispanics may be of any race. ** Data from U.S. Census Bureau, 2012 American Community Survey 1-Year Estimates. Source: U.S. Census Bureau, Current Population Survey, 2013 Annual Social and Economic Supplement.
U.S. Median Income for Persons Age 25 and Older, by Sex and Educational Attainment: 2012 Source: U.S. Census Bureau, Current Population Survey, 2013 Annual Social and Economic Supplement.
U.S. Per-Capita Income, Median Household Income, and Median Family Income: 1967 to 2012 Source: U.S. Census Bureau, 2012 American Community Survey 1-Year Estimates.
Percentage of U.S. Persons Below Poverty Level, by Race and Ethnicity: 1976 to 2012 Source: U.S. Census Bureau, Current Population Survey, 2013 Annual Social and Economic Supplement.