Download
1 / 25
320 likes | 572 Views
Introduction to Scientific Method: Observation and Data. AP Biology Ms. Gaynor. Observation : using your 5 senses to collect information Data : scientific information Inference : a logical conclusion or assumption based on your observations. DATA. 2 TYPES:

E N D
Introduction to Scientific Method:Observation and Data AP Biology Ms. Gaynor
Observation: using your 5 senses to collect information • Data: scientific information • Inference: a logical conclusion or assumption based on your observations
DATA 2 TYPES: • Quantitative: includes observations or data that involves numbers (#’s), amounts or quantities • Qualitative: includes observations that DO NOT involve numbers; Observations or data that is descriptive.
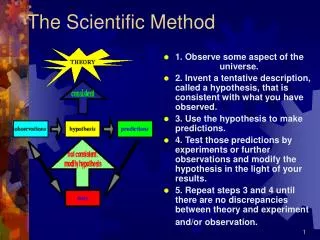
What are the steps? **(Initial) Observation : use your 5 senses 1.State the problem or question: ●What are you trying to solve or research? 2.Form your hypothesis: • an educated or logical prediction to answer your problem question; use your prior knowledge • Not just a “guess” • IT MUST BE TESTABLE!!! • “If…then…because” statement 3.Plan your experiment: ●decide your procedure, control, variables & materials
4.Perform your experiment: • Collect data (both qualitative and quantitative) 5.Analyze your data (Results): • Make sense of your data • put it in LINE graphs/charts/table, etc. 6.Conclusion: • Sum up your findings (data) • Restate your hypothesis and state whether it is rejected or accepted based on your results • CITE your quantitative and/or qualitative data!!! EXPLAIN your numerical data. • State and EXPLAIN any experimental error(s) (called error analysis)
A Controlled Experiment • Experiment= process to collect data • There are (usually) 2 groups in an experiment: • Experimental (or test) group • Control group
Example:HOW WILL FERTILIZER AFFECT PLANT GROWTH? WITH FERTILIZER WITHOUT FERTILIZER (plants normally don’t have fertilizer) >>>>ONLY CHANGE (test) 1 VARIABLE (thing): THE PRESENCE OF FERTILZER Conditions (or variables) that NEED to remain the same for a controlled experiment: • AMOUNT OF SUNLIGHT, • SOIL, • TYPE OF POT, • TEMPERATURE, • SPECIES OF PLANT TEST GROUP + + CONTROL GROUP
A controlled experiment will have 2 different variables: • Independent variable (“If….then…) • Dependent variable (If…then…)
Independent Variable I. T. Dependent Variable M. D. I is for Independent T is for Test M is for Measurement D is for Dependent
Example:HOW WILL FERTILIZER AFFECT PLANT GROWTH? WITH FERTILIZER WITHOUT FERTILIZER (plants normally don’t have fertilizer) Independent variable: WHAT ARE YOU TESTING? • Fertilizer Dependent variable: WHAT ARE YOU MEASURING? • Plant Growth TEST GROUP + + CONTROL GROUP
Now let’s practice with Spongebob… • Which people are in the control group? What is the independent variable? Patty Power Mr. Krabbs wants to make Bikini Bottoms a nicer place to live. He has created a new sauce that he thinks will reduce the production of body gas associated with eating crabby patties from the Krusty Krab. He recruits 100 customers with a history of gas problems. He has 50 of them (Group A) eat crabby patties with the new sauce. The other 50 (Group B) eat crabby patties with sauce that looks just like new sauce but is really just the old sauce with food coloring. Both groups were told that they were getting the sauce that would reduce gas production. Two hours after eating the crabby patties, 30 customers in group A reported having fewer gas problems and 8 customers in group B reported having fewer gas problems. • What is the control group? • What is the independent variable? • What is the dependent variable? Group B Type of Sauce Amount of gas
Testing Hypotheses • Science can only test hypotheses that can be proven false • This is why statements like “God did it.” are not scientific and will not be part of this class • New techniques and knowledge have made previously unscientific hypotheses available for testing • Great scientists use creativity to make hypotheses testable in new, more simple, and better controlled ways • Experiments either reject or fail to reject (often discussed as support) the hypothesis • Each experiment that fails to reject a given hypothesis lends support to the idea that the hypothesis is correct • Rejection leads to modification or dismissal of hypothesis
Theory vs. Models • Scientists test hypotheses MANY times in different ways!(i.e.- w/ new research tools, equipment, etc) • Many “types” of knowing…science-based knowledge based on careful, repeated observations/testable hypotheses. • THEORY= a well-tested explanation that is supported by A LOT of evidence (data) • Much broader than a hypothesis • MODEL= physical, mental or mathematical representations of how people understand a process or idea
Additional Information… • Essential to ALL experiments is: • Replication!!! • You NEED to consider your number of trials • Use the EXACT same conditions in EACH trial • Why? • To determine if the results are consistent this INCREASES our confidence in the resulting data • BUT… • A certain amount of variation is NORMAL! • Increasing trial # allows us to obtain an AVERAGE RESULT from different trials.
Additional Information… • Essential to ALL experiments is: 2) Sample size • You NEED to consider your sample size when drawing conclusions • For example… • You are working with plants and decide to plant 2 control plants and 2 test plants. • 1 test plant and 2 control plants die during the experiment • WHAT HAPPENS NOW?
Additional Information… • Essential to ALL experiments is: 3) Clear procedure • Do NOT use pronouns! • Use “directional” language • Example: • Place ______ in _____. • Fill 20 ml of water in a 50 ml graduated cylinder • Someone MUST be able to REPEAT your procedure over and over to produce similar results!!
X- Axis = Independent variable • If time is present, it is ALWAYS the x-axis (independent variable) • Y- Axis = Dependent variable
T.A.I.L.S for graphs • T = Title is present • A = Correctly label x and y axes • I = Use consistent intervals on axes • L = Label a key • S = Use a proper scale (don’t always start at 0)
More practice with Spongebob… • http://sciencespot.net/Media/scimethodconvar.pdf#search='spongebob%20variable%20worksheet’
So how do you know if your hypothesis is rejected? STATISTICS!! • Statistics are used to describe data sets, compare sets of data, and estimate how close data is to describing all possible data • Mean = Average value of all data • Mode = Most common value in data set • Median = Middle # in an ordered data set • Arrange all #’s in order; pick middle most value • Range = the span of a number set (Ex: lowest # through the highest #; 10-30) Sum of all Data X- Mean = Number of samples
Variance (V) • Means the variability of a population • For each individual number in your data set, • Subtract the mean from each data set # • square the results • continue for each data point • SUM ALL RESULTS X= each individual data # n= number of individuals measured (numbers of values in your data set) Σ = Sum X = mean
Standard Deviation (SD) • A test of how close the data is to the mean • Low SD means all data close to mean • Like throwing darts and getting almost all bullseyes • Data is more consistent • High SD means data spread widely from the mean • S = the square root of variance • S = √variance
Standard Error (SE) • A description of how close your data set got to “reality” • You can never sample all possible outcomes; you can only sample a small portion • By taking into account the SD and sample size of your data, SE can estimate how close you got to the “real” mean 70% sure contains “real” mean 1 X SE SD 95% sure SE = 2 X SE ~100% sure √Number of Samples 3 X SE Range of Data Sample Mean