Download
1 / 70
700 likes | 934 Views
Presenting Data in Tables & Charts. Organizing Numerical Data. Data with 20 or more observations should be organized. The Ordered Array : arranges raw data in order from the smallest observation to the largest observation. Raw Data Arranged in an Ordered Array.

E N D
Presenting Data in Tables & Charts Organizing Numerical Data
The Ordered Array: arranges raw data in order from the smallest observation to the largest observation.
extreme values • typical values • range where the majority of values are concentrated
Stem and Leaf Display: shows where raw data clusters over a range of observations.
EXAMPLE: the following data represent the weekly salary checks earned by a sample of eight secretaries: $555 $490 $648 $832 $710 $590 $576 $623
First, put the values in ascending order and then use the 100s column as the stems, use the 10s column as the leaves, and either ignore the units column or round the units column and then use the 10s column as the leaves.
$555 $490 $648 $832 $710 $590 $576 $623 4 | 9 5 | 579 6 | 24 7 | 1 8 | 3
To further illustrate, how we can organize data to present, analyze and interpret findings,
we will study data from a previous QBA questionnaire: 1) USD students’ auto costs • 2) USD students’ maximum auto speeds
Numerical Data • Frequency Distribution • Relative Frequency Distribution • Percentage Frequency Distribution • Cumulative Frequency Distribution
Selecting the Number of Classes • There is no “correct” number of classes (K) to use in a frequency distribution. • However, the frequency distribution should have at least 5 classes, but no more than 20
Caution! • If you have too “FEW” classes (K), a large portion of your data, lies in one class. • However, if there are a number of empty classes, or too many classes with a frequency of 1 or 2, this may indicate too “MANY” classes (K).
Approximate Number of Classes in Frequency Distribution # Observations # Classes Less than 50 5 – 7 50 – 200 7 – 9 200 – 500 9 - 10 500 – 1,000 10– 11 1,000 – 5,000 11- 13 5,000 – 50,000 13 – 17 More than 50,000 17 - 20
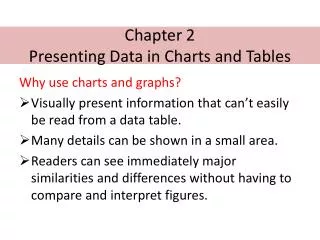
What do you gain by organizing your data in a Frequency Distribution?
Hint! From pages of raw data
Answer • Reduce large numbers of data points to a workable number of classes and frequencies. • Study the frequency distribution and learn a great deal about the shape of the data set.
Constructing a Frequency Distribution • Gather the sample data • Arrange data in an Ordered Array • Select the number of classes to be used • Determine class width: range/ # of classes • Determine the class limits for each class so that the distribution is easy to interpret • Count the number of data values in each class (the raw frequencies) • Determine the Relative Frequencies
Relative Frequency = Raw frequency count in each class -------------------------------------- Total number of observations (n)
Relative Frequency is essential for comparing the relationship between two data sets.
To Convert Relative Frequency to Percent Frequency: Multiply Relative Frequency X 100
Graphic Techniques to Describe Numerical Data 1) Histogram (continuous data) 2) Polygon 3) Ogive 4) Scattergram
Histogram • Uni-modal • Bi-modal • Skewed: i) right or positively skewed ii) left or negatively skewed
Quiz Would incomes of employees in large firms tend to be positively or negatively skewed? Why?
Quiz Do exam grades tend to be positively or negatively skewed? Why?
A Scatter Diagram Graphs bivariate data to examine whether a relationship exists between two numerical variables.
Is there a relationship between the price of their auto and the maximum MPH a USD student has driven?
Is there a relationship between the number of alcoholic beverages consumed per week and the number of hours studied per week?