Download
1 / 76
790 likes | 1.05k Views
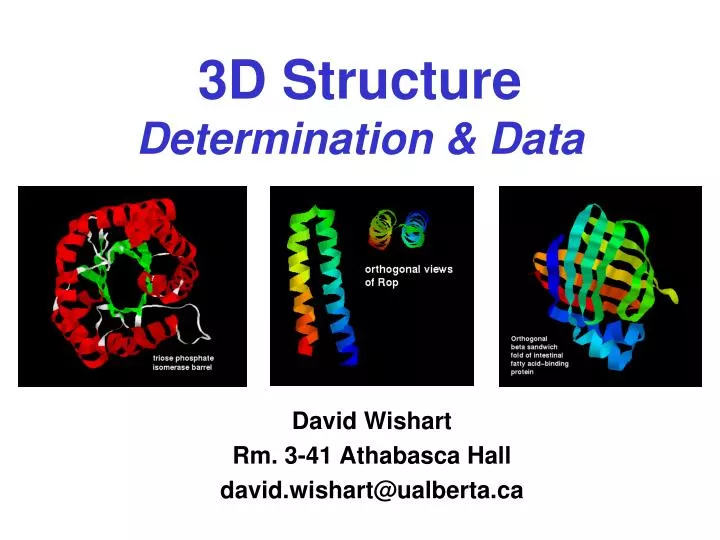
3D Structure Determination & Data. David Wishart Rm. 3-41 Athabasca Hall david.wishart@ualberta.ca. Outline for Next 3 Weeks. Introduction to protein structure Methods for visualizing structure Homology modeling Protein structure prediction Proteomics – part 1 Proteomics – part 2.

E N D
3D StructureDetermination & Data David Wishart Rm. 3-41 Athabasca Hall david.wishart@ualberta.ca
Outline for Next 3 Weeks • Introduction to protein structure • Methods for visualizing structure • Homology modeling • Protein structure prediction • Proteomics – part 1 • Proteomics – part 2
Objectives* • Review of amino acid and polypeptide structure • Gain and understanding of protein structure determination methods (NMR and X-ray) • Learn about the Protein Data Bank • Learn some of the approaches to Rendering, Modelling and Viewing 3D Structures
Much Ado About Structure* • Structure Function • Structure Mechanism • Structure Origins/Evolution • Structure-based Drug Design • Solving the Protein Folding Problem
C H2N COOH H Glycine and Proline* H C HN COOH H P G
CH3 CH3 CH3 C C C C H2N H2N H2N H2N COOH COOH COOH COOH CH3 CH3 H H H H Aliphatic Amino Acids* CH3 CH3 V I A L
C C C C H2N H2N H2N H2N COOH COOH COOH COOH H H H H Aromatic Amino Acids* N N N W H OH Y F
C C C C H2N H2N H2N H2N COOH COOH COOH COOH H H H H Charged Amino Acids* H - COO + N D NH3 R NH + NH3 - COO E K
C C C C H2N H2N H2N H2N COOH COOH COOH COOH H H H H Polar Amino Acids* CH3 OH CONH2 N T CONH2 OH Q S
C C H2N H2N COOH COOH H H Sulfo-Amino Acids* CH3 S SH M C
- - - - Table 10 SecondaryStructure*
Lactate Dehydrogenase: Mixed a / b Immunoglobulin Fold: b Hemoglobin B Chain: a Tertiary Structure*
Solving Protein Structures* • Only 2 kinds of techniques allow one to get atomic resolution pictures of macromolecules • X-ray Crystallography (first applied in 1961 - Kendrew & Perutz) • NMR Spectroscopy (first applied in 1983 - Ernst & Wuthrich)
X-ray Crystallography* • Crystallization • Diffraction Apparatus • Diffraction Principles • Conversion of Diffraction Data to Electron Density • Resolution • Chain Tracing
Crystallization Protein Crystal Protein crystallization proceeds in two steps. The first step screens precipitants and conditions that lead to protein precipitation. The second step tries to refine the precipitation steps so that the protein crystallizes instead of precipitating
Crystallization* Hanging Drop Experiment for Cyrstallization
A Bigger Diffraction Apparatus Synchrotron Light Source
Diffraction Principles* nl = 2dsinq
Diffraction Principles Corresponding Diffraction Pattern A string of atoms
Protein Crystal Diffraction Diffraction Pattern
Fourier Transformation* i(xyz)(hkl) F(x,y,z) = f(hkl)e d(hkl) Converts from units of inverse space to cartesian coordinates
MAD & X-ray Crystallography* • MAD (Multiwavelength Anomalous Dispersion • Requires synchrotron beam lines • Requires protein with multiple scattering centres (selenomethionine labeled) • Allows rapid phasing • Proteins can now be “solved” in just 1-2 days
Resolution* 1.2 Å 2 Å 3 Å Resolution describes the ability of an imaging system to resolve detail in the object that is being imaged.
Chain Tracing Electron Chain Final Density Trace Model
The Final Result ORIGX2 0.000000 1.000000 0.000000 0.00000 2TRX 147 ORIGX3 0.000000 0.000000 1.000000 0.00000 2TRX 148 SCALE1 0.011173 0.000000 0.004858 0.00000 2TRX 149 SCALE2 0.000000 0.019585 0.000000 0.00000 2TRX 150 SCALE3 0.000000 0.000000 0.018039 0.00000 2TRX 151 ATOM 1 N SER A 1 21.389 25.406 -4.628 1.00 23.22 2TRX 152 ATOM 2 CA SER A 1 21.628 26.691 -3.983 1.00 24.42 2TRX 153 ATOM 3 C SER A 1 20.937 26.944 -2.679 1.00 24.21 2TRX 154 ATOM 4 O SER A 1 21.072 28.079 -2.093 1.00 24.97 2TRX 155 ATOM 5 CB SER A 1 21.117 27.770 -5.002 1.00 28.27 2TRX 156 ATOM 6 OG SER A 1 22.276 27.925 -5.861 1.00 32.61 2TRX 157 ATOM 7 N ASP A 2 20.173 26.028 -2.163 1.00 21.39 2TRX 158 ATOM 8 CA ASP A 2 19.395 26.125 -0.949 1.00 21.57 2TRX 159 ATOM 9 C ASP A 2 20.264 26.214 0.297 1.00 20.89 2TRX 160 ATOM 10 O ASP A 2 19.760 26.575 1.371 1.00 21.49 2TRX 161 ATOM 11 CB ASP A 2 18.439 24.914 -0.856 1.00 22.14 2TRX 162 http://www.ruppweb.org/Xray/101index.html
NMR Spectroscopy Radio Wave Transceiver
Principles of NMR* • Measures nuclear magnetism or changes in nuclear magnetism in a molecule • NMR spectroscopy measures the absorption of light (radio waves) due to changes in nuclear spin orientation • NMR only occurs when a sample is in a strong magnetic field • Different nuclei absorb at different energies (frequencies)
Principles of NMR* N N hn S S Low Energy High Energy
FT NMR Free Induction Decay FT NMR spectrum
Fourier Transformation* iwt F(w) = f(t)e dt Converts from units of time to units of frequency
8.0 7.0 6.0 5.0 4.0 3.0 2.0 1.0 0.0 1H NMR Spectra Exhibit...* • Chemical Shifts (peaks at different frequencies or ppm values) • Splitting Patterns (from spin coupling) • Different Peak Intensities (# 1H)
SDS PAGE 2D Gels & 2D NMR
Multidimensional NMR* 1D 2D 3D MW ~ 500 MW ~ 10,000 MW ~ 30,000
The NMR Process* • Obtain protein sequence • Collect TOCSY & NOESY data • Use chemical shift tables and known sequence to assign TOCSY spectrum • Use TOCSY to assign NOESY spectrum • Obtain inter and intra-residue distance information from NOESY data • Feed data to computer to solve structure