Download
1 / 13
130 likes | 133 Views
This report provides an overview of the responsibilities and review of individual indicators related to agri-environment at the European Environment Agency (EEA) Working Party. The report covers 9 indicators across 4 thematic areas: biodiversity, water, air emissions, and land use change. The aim of the report is to document agri-environment trends in Europe, support policy processes, and advance integrated environmental analysis.

E N D
Agri-environment indicator work at the European Environment Agency (EEA) Working party ‘Agriculture and Environment’, Eurostat, 26-27 June 2008
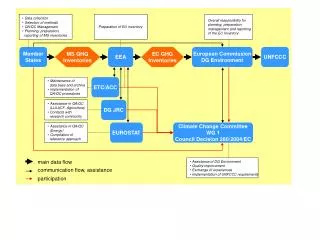
Organisation of AE analysis at the EEA • Land use group (coordination, land cover change, water accounts, rural + mountain areas) • Water and agriculture group (agri-water issues, AE indicators) • Biodiversity group (HNV farmland, Natura 2000, Indicators for 2010 biodiversity target) • Scenario group (trend projections, exploratory studies) • CC and energy group (bio-energy issues) + joint activities with partners of MoU..
Overview of EEA agri-environment indicator responsibilities • 9 indicators altogether • 2 ‘A’, 5 ‘B’ , 2 ‘C’ indicators • 4 thematic areas: biodiversity, water (pollution + abstraction), air emissions, land use change • Most data flows based on environmental reporting and monitoring processes • Interest in many other indicators…
Review of individual indicators (I) • No 2 Agricultural Areas under Natura 2000 • Natura 2000 reporting / CORINE land cover • No specific data flow under agricultural statistics • No 9 Land use change • Is based on CORINE land cover • Can this be validated with country level data?
Review of individual indicators (II) • No 18 Ammonia emissions and • No 19 Greenhouse gas emissions • Both based on international conventions for reporting on air emissions (UNFCCC) • Existing data flows well-established but modeling needs to be improved for No 18 • No 20 Water abstraction • Based on irrigated area + water use statistics • ‘C’ indicator but focus of work at EEA
No 20 Water Abstraction • National water use by agriculture is weighted regionally using regional irrigated area (OECD/Eurostat & FSS data) • Clear spatial pattern across Europe, reasonable spatial and temporal coverage • WFD relevant, although RBD scale would be better
Review of individual indicators (III) • No 22 Genetic diversity • Data basis is very weak (‘C’ indicator) • Relies on very diverse FAO statistics • No 25 Population trends of farmland birds • Data derive from bird monitoring organised by BirdLife and EBCC • A reasonable basis but more work to be done
Review of individual indicators (IV) • No 27.1 Water quality – Nitrate pollution • Based on national reporting • Data availability is improving • Challenge is regional / water basin level • No 27.2 Water quality – Pesticide pollution • Based on national reporting + data are weaker • Challenge is further data improvement + moving to regional / water basin level reporting
No 27. 1 Water Quality – Nitrate Pollution • Data availability – increasing rapidly • Eionet-Water; selected national monitoring sites • Rivers and ground water • Long time-series • Issue regarding missing data • Policy relevant – e.g. Nitrates Directive • Regional trends identifiable
No 27.1 Water quality - Nitrate Pollution ● Mapping of data within WISE, e.g. at a (WFD) River Basin Scale
No 27.2 Water Quality - Pesticide Pollution • Large recent growth in data (Eionet) • Mixed quality – temporal and spatial variations, pesticides get banned, new ones are introduced. • Issue (as with N) is to discriminate the agricultural influence
Thank you for your attention! Jan-Erik.Petersen@eea.europa.eu
EEA agri-env. reporting aims to: • Document agri-env. trends in Europe • Be spatially explicit (water basin level, NUTS regions, grid/local level) • Link to major policy processes (CAP reform, WFD directive, Natura 2000..) • Support environmental policy integration • Advance the development of integrated environmental analysis