Download
1 / 59
590 likes | 676 Views
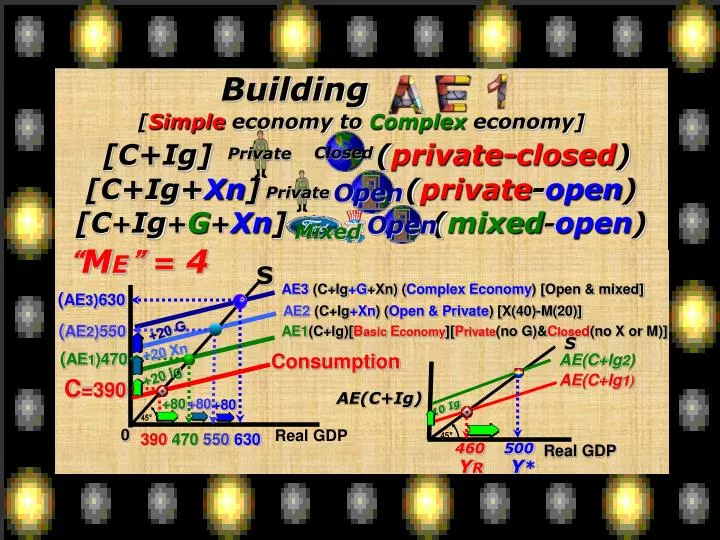
Building [ Simple economy to Complex economy] [C+Ig] ( private-closed ) [C+Ig+ Xn ] ( private - open ) [C + Ig + G + Xn ] ( mixed - open ). Closed. Private. Private. Open. Open. Mixed. “ M E ” = 4. S.

E N D
Building [Simple economy to Complex economy] [C+Ig] (private-closed) [C+Ig+Xn] (private-open) [C+Ig+G+Xn] (mixed-open) Closed Private Private Open Open Mixed “ME” = 4 S AE3 (C+Ig+G+Xn) (Complex Economy) [Open & mixed] (AE3)630 AE2 (C+Ig+Xn) (Open & Private) [X(40)-M(20)] (AE2)550 +20 G AE1(C+Ig)[Basic Economy][Private(noG)&Closed(no X or M)] S +20 Xn (AE1)470 Consumption AE(C+Ig2) +20 Ig AE(C+Ig1) C=390 AE(C+Ig) +80 +80 +80 10 Ig 0 Real GDP 390470550630 460 500 Real GDP YRY*
o 45 Building the Model AE[C+Ig] [“Basic” or “Simple” economy] S C + Ig Multiplier-4 $530 510 490 470 450 430 410 390 370 Private Closed Consumption Equilibrium Ig = $20 Billion AE[C+ Ig](billions ofdollars) C =$450 Billion + 20 Ig +80 o Real GDP 370 390 410 430 450 470 490 510 530 550 GDP will increase by a “multiple” of 4 & that is why it is called the “multiplier”.
o 45 Change in(or QS) [Income change, movement from point to point] S SAVING Consumption Breakeven So, the key to a change in QC(QS) is a change in ? Consumption C2 C1 DISSAVING o DI3 DI1 DI2 (Disposable Income) S SAVING Saving o S DISSAVING Disposable Income
Increase in Consumption(Decrease in Saving) [shift/whole curve/non-income] o 45 C2 May be caused by: Increase in wealth Decrease in PL Expect. PL incr. Expect. of positive Y Expect. of shortages Decrease in debt *Decrease in taxes *Decrease in taxes increases both C & S C1 Increases in consumption means… Consumption o Disposable Income I’ll buy more and save more. Decrease in saving S1 S2 Saving o Disposable Income
o 45 Decrease in Consumption(Increase in Saving) [shift/whole curve/non-income] May be caused by: Decrease in wealth Increase in PL Expect. PL decrease Expect. neg. future Y Increase in debt *Increase in taxes *Increase in taxes decreasesboth C & S C1 C2 Consumption Decreases in consumption means… o Disposable Income Increase in saving S2 S0 Saving o Disposable Income
.986 .976 .972 .940 .907 .873 .869 .842 GLOBAL PERSPECTIVE Average Propensities to Consume, Selected Nations, 2000 .80 .85 .90 .95 1.0 Canada United States Netherlands United Kingdom Germany Italy Japan France
NON-INCOME DETERMINANTS [Shifters]OF CONSUMPTION AND SAVING • Wealth • Increase or decrease in wealth • Consumer Expectations • [about future availability, income, & prices] • Household Debt • Increase/decreasein PL • Taxationincreases/decreases
Real Interest Rate [Nominal I.R.–inflation rate=Real I.R.] 7% 12% 5% - = Anticipated Inflation Nominal Interest Rate Real Interest Rate
Marginal Efficiency of Investment [MEI] [If expected returns equal or exceed the real interest rate of interest, the firm will normally make the investment.] [One firm’s demand curve for investment] 30% 25% 20% 15% 10% 5% MEI = 27% MEI=20% MEI=15% MEI=12% MEI = 7% Add new wing to factory $1 mil. Acquire additional power facilities $1.5 mil. Purchase machines $1.5 mil. Renovate plant $2 million Install computer system $1 mil. 0 1 2 3 456 [QID] Quantity of Investment Demanded (millions)
[MEI] 25% 20% 15% 10% 5% DI(MEI) [Economy’s AD curve for Ig] Firms borrow to invest. [A 20% cost of funds attract $100 billion of investment I.R. QID A 5% cost of funds attracts $200 B Ig 0 50 150 200 250 100 QID1 QID2 Change in QID [interest rate change, point to point movements]
Should A NewDrill PressBe Purchased? Single Firm • Positive profit expectations and the real interest rate • are the most important determinants of investment. • Drill Press - $1,000 • A. Expected gross profits = $1,100 or a 10% return. • [$100/$1,000 x 100 = 10%] • [At 8%, invest; at 12%, don’t invest] • B. Real interest rate [nominal interest rate-inflation]
Change in Quantity of Investment Demanded [QID] (Interest rate change, point to point movement) DI 16 14 12 10 8% 6 4% 2 0 Firms will undertake all investments [additions to plant, equipment, inventory, and residential construction] which have an expected rate of net profit greater than [or equal to] the real rate of interest. Expected rate of return, r, and interest rate, i (percents) Monetary Policy– by lowering interest rates, the Fed can increase Ig & employment. • 10 15 20 25 30 35 40 • QIDQID Investment (billions) [Inverse relationship between real interest rate and QID]
CHANGE [Shift]IN INVESTMENT [curve] • Increase in Investment • Positive profit expectations • Scarcity of inventory • Technology [innovation] • Decrease in production costs • Decrease in business taxes I2 I1 8% QID2 QID1
INVESTMENT DEMAND & SCHEDULE Investment Demand Curve Investment Schedule Ig independent of Y DI Ig 20 Expected rate of return, r, and real interest rate, i (percents) Investment (billions of dollars) 8 20 20 20 Y1 Y2 Y3 Investment (billions of dollars) Real Domestic Product, GDP (billions of dollars) In constructing the AE graph, Ig will be independent [not influenced] by income. Investment decisions are made months ahead.
NS 1-6 “Closed” and “private” [C+Ig] “Simple Economy” “Open” & “private” [C+Ig+Xn] “Open” & “mixed”[C+Ig+G+Xn] “Complex Economy” C+Ig Assumptions:No internat. trade or “G” ; no business saving; depreciation & NFFIEUS are 0; PL is constant [Keynesian] [GDP = DI] Closed 1. The most important determinant of consumerspending is (wealth/indebtedness/income). 2. As aggregate income increases, consumption and saving both (increase/decrease). 3. The (consumption/saving) schedule shows how much households plan to consume at various income levels. 4. Dissaving occurs where consumption (exceeds/is less than) Y. 5. If the consumption schedule shifts upward [not caused by a tax change], the saving schedule will shift (upward/downward). 6. (The expectation of a recession/A change in consumer incomes/ An expected change in the price level) will not cause the consumption curve to shift.
APC and APS APC - percentage of income (“Y”) consumed. APC = C/Y(DI) = $48,000/$50,000 = .96 APS = S/Y(DI) = $2,000/$50,000 = .04 APS – percentage of income (“Y”) saved. “Econ, Econ, APS=S/Y 1 APC = C/Y = $52,000/$50,000 = 1.04 APS = S/Y = -$2,000/$50,000 = -.04 AE=GDP 1 APC=C/Y APS = S/Y “High maintenance Econ teacher”
M=1/MPS MPC, MPS, & theMultiplier MPC-% change in Y consumed. MPS-% change in Y saved. MPC = C/ Y = $750/$1,000 = .75 MPS = S/ Y = $250/$1,000 = .25 Multiplier = 1/.25 = $1/.25 = “M” of 4 [MPC is important for G in policy making decisions.] *The ME is The reciprocal of the MPS. The “M” works like a concentric circle.
The First Round of Government Spending Causes The Biggest SplashMPC of 75%G spends $200 billion on the highways. Highway workers save 25% of $200 billion [$50 billion] & spend 75% or $150 billion on boats. Boat makers save 25% of $150 bil. [$37.50 bil.] & spend 75% or $112.50 bil. on iPod Minis, etc.
ME = 1/MPS, 1/.25 = $1/.25 = M of 4 M is 4 & we are short of Y*[$840] by $40 billion o 45 AE[C+Ig+G] Equilibrium AE[C+Ig] AE[C+Ig+G](billions ) G= $10 Billion + 10 G +40 Recess. Spending gap Recess. Gap o Real GDP 800840 YrY* Recessionary GDP Gap “M” = Y/ E = 40/10 = 4
ME = 1/MPS, 1/.50 = $1/.50 = M of 2 M is 2 & we are short of Y*[$840] by $40 billion o 45 AE[C+Ig+G] Equilibrium AE[C+Ig] AE[C+Ig+G](billions ofdollars) G= $20 Billion + 20 G +40 Recess. Spending gap Recess. Gap o 800 YR Real GDP 800840 Yr Y* Recessionary GDP Gap “M” = Y/ E = 40/20 = 2
ME = 1/MPS, 1/.50 = $1/.50 = M of 2 M is 2 & we are beyond Y*[$840] by $40 billion o 45 AE [C+Ig+G] 2 x -? = -40 AE[C+Ig-G] Equilibrium Inflationary Spending gap=$20 B AE[C+Ig+G](billions ofdollars) -20 G -40 Inflat. Gap o Real GDP 800 840 880 Yr Y*Yi Inflationary GDP Gap
MPC 1/MPS = M .90 1/.10 = 10 .80 1/.20 = 5 .75 1/.25 = 4 .60 1/.40 = 2.5 .50 1/.50 = 2 ME [Change in G, Ig, or Xn] = 1/MPS
MT [Change in Taxes] = MPC/MPS MPC MPC/MPS = M .90 MPC/.10 = 9 .80 MPC/.20 = 4 .75 MPC/.25 = 3 .60 MPC/.40 = 1.5 .50 MPC/.50 = 1
ME = 1/MPS MT= MPC/MPS MPC MT ME 90% .910 9 50% .85 4 The 2000 Olympics resulted in $3 1/2 billion to Australia’s economy over a year’s time. The Texas-Oklahoma gamebrings $21 mil to D-FW. 2005 Cotton Bowl brought $30 million to D-FW. Super Bowl brought $166 million to Houston. Fiesta Bowl for national title brought in $85 million. Big 12 Tournament brought $45 million to D-FW .754 3 .602.5 1.5 .52 1 Notice the 2ndround with .9versus.5 The larger the MPC, the smaller the MPS, and the greater the multiplier. This is the “simple multiplier” because it is based on a“simple model of the economy”. OU
Super Bowl - $166 Million For Houston • $150 - Parking ratesaround the stadium • $500-$600per Super Bowl ticket [$2,000-$6,000on E-Bay for a seat] • $12,000 – cost ofSuper Bowltrophy • $2.3 million – 30 second ad • $50,000 – Super Bowl Ring • 68,000to each player on thewinning team • $36,500 to each player on the losing team. • $3.35 million to the winning team • $2.59 million to the losing team • Hotels - $69 M; bars & restaurants-$27 M; entertainment-$15M; transportation-$15 M; and retail sales-$41 M Reliant Stadium
Step by Step Working of “Multiplier” [MPC is .5] Government increases spending by $1 billion with a multiplier of 2 $1,000.00 500.00 250.00 125.00 62.50 31.25 15.625 7.8125 3.90625 1.953125 .9765625 .48828125 .244140625 .1220703125 .06103515625 .030517578125 .015258789062 $2,000,000,000 On new highways Highway workers buy new boats Boat builders buy plasma TVs TV factory workers buy new cars Auto workers buy “wife beater shirts” Apparel workers spend $ on movies Movie moguls spend money on Christina Agulera’s “Come On Over.” “Come on over.” [Increased by a multiple of 2]
Let’s Go To Padre Island and Party With The Multiplier These are Texas A&M students At Padre. UT student • During spring break, college students like to head to Padre Island. The “multiplier” is getting ready to work. • With dollars in their pockets, the students spend money on food and drink, motel rooms, dance clubs, etc. These dollars raise total income there by some multiple of itself. • College students buy pizzas, beer, and sodas. The people who sell these items find their incomes rising. They spend some fraction of their increased income, which generates additional income for others. • If the students spend $8 million at Padre and the MPC is .60, then college students will increase income in Padre by $20 million. • When the networks show scenes on the beach, the average person simply sees college students having a good time. • But – economists see the multiplier at work, generating higher levels of income for many of the residents of Padre Island.
NS 7 – 10 7. The APC indicates the percent of total income that will be (consumed/saved). 8. The MPC is the fraction of a change in income which is (spent/saved). 9. The greater is the MPC, the (larger/smaller) the MPS, and the (larger/smaller) the multiplier. 10. With a MPS of .4, the MPC will be (.4/.2/.6) and the multiplier will be (2/2.5/4). Multiplier – As the money goes from one person, to another, to another…
Building [Simple economy to Complex economy] [C+Ig] (private-closed) [C+Ig+Xn] (private-open) [C+Ig+G+Xn] (mixed-open) Private Closed Private Open Open Mixed “ME” = 4 S AE3 (C+Ig+G+Xn) (Complex Economy) [Open & mixed] (AE3)630 AE2 (C+Ig+Xn) (Open & Private) [X(40)-M(20)] (AE2)550 +20 G AE1(C+Ig)[Basic Economy][Private(noG)&Closed(no X or M)] +20 Xn (AE1)470 Consumption +20 Ig C=390 +80 +80 +80 InjectionsLeakages 1. Investment[20] = 1. Saving[20] 2. Exports[10]=2. Imports[10] 3. Government[20]= 3. Taxes[20] 0 390470550630 Real GDP Notice that the injections are autonomous (independent) of Y
How to figure the MPC & MPS [MPC = C/ Y] [MPS = S/ Y] o 45 S SAVING D MPS=? CD/EF Consumption Consumption C2 C MPC=? BC/EF A C1 B Dissaving o F H E Disposable Income
Review S AE1[C+Ig] H $1,000 Consumption AE [C+Ig] $700 I J $400 P 200400 1,000 bil. 0N QK Real GDP Consumption will be equal to income at income level ? $400 With Ig [C+Ig], the MPC is? PI/QK The MPS is ? HI/QK What income level represents “dissaving”? $200
NS 11-16 Consumption D Consumption 11. The APC is one at letter (A/B/C/D). 12. The MPC is equal to (AE/OE or CB/AB). [moving from OE to OF] 13. At income level “OF” the volume of saving is (CB/CD). 14. Consumption will be equal to income at incomelevel (OH/OE). 15. The economy isdissaving at income level (OH/OF). 16.The MPS is (CD/EF or CB/EF). [moving from OE to OF] C A B H E F 0 Income
An Increase in G of $20B is more expansionary than adecrease in T of $20 B [If the MPC is .75,ME is 4but theMT is only 3] Incr G spending by $20 bil. “ME” of 4 [1/.25] [20 x 4 = $80] S AE2(C+Ig+G) AE AE1(C+Ig) “Big 12” Tournament brings $45 million to the DFW economy. Let’s see, anyone’s spending (G,Ig, or Xn) becomes someone else’s income, so there will be an increase in “C”. +20G +80 YRF* 500 580 AAC “Tax cut” of $20 billion “MT” = 3 [.75/.25] x 20 = $60 S AE AE2 AE1 +20T +60 [Need a 25% larger “Tax cut” to get to $580] “Tax cut of $25.67 billion x 3 = $80] YRY* 500580 560
Increase in G of $40Billion with MPS of .5 1st Round = $40 billion spent on the highways 2ndRound=$20 billion on motorcycles The multiplier is the multiple in which an initial change in aggregate spending will alter total spending after an infinite # of spending cycles. Total spending change = M X new spending injection. 3rd Round, only $10 billion spent oncorvettes
Decrease in Taxes of $40 B with MPS of .5 With MPS of .50, $20 is saved & & only $20 bil is spent 1st round. Leakage of 50% [saving of $20 bil.] in the first round 2nd Round: only $10 bil. is spent. 3rd Round only $5 bil. is spent.
Balanced Budget Multiplier (“1”) [Increase G & T by $20 billion] $20G$20T S ME of 2&MT of 1 ME of “2”[So MT is “1”] [+20] “G” 40 AE2[C+Ig] -20 “T” AE1[C+Ig] AE ME of 5&MT of 4 +20 G&T ME of “5”[So MT is “4”] [+20] “G” 100 +$20 “T” -80 $600 $620 ME of 10&MT of 9 ME of “10”[So MT is “9”] [+20] “G” 200 -180 “T”
Balanced Budget Multiplier [$20 billion] [“T” affects AD indirectly thru “C”; “G” affects AD directly] GDP = $80 The increase in “G” flows directly into the economy. +$20 Net Change in GDP = The increase in “T” means we would have consumed $15 and kept $5 in our pockets. GDP = -$60 G $20 Sa= -$5 T $20 Ca= -$15 ME = 1/MPS ME = 1/.25 = 4 So, 4 x $20 = $80 MT = MPC/MPS=.75/.25=3 So, 3 x -$20 = -$60 AS AD2 AD1 PL $490 billion $470 billion
TheME, MT, & MBBMultipliers ME[G, Ig, or Xn] = 1/MPS = 1/.25 = 4 So, G increaseof $10 bil. will incr Y by $40 bil.[$10x4=$40] And a Gdecreaseof $10 bil. will decrease Y by $40 bil.[-$10x4=-$40bil.] MT = MPC/MPS = .75/.25 = 3 So, Tdecrease of $10 bil. will incr Y by $30 bil.[$10 x 3=$30] And a Tincreaseof $10 bil.will decr Y by $30 bil. [-$10x3=-$30] MBB = 1 So, an increasein G&Tof $10 bil. will incr Y by $10 bil. [$10x1=$10] And adecreasein G&T of $10 bil. will decr Y by $10 bil.[-$10x1=-$10] Any increase in expenditures x the M will increase GDP. Any decrease in expenditures x the M will decrease GDP.
INSTRUCTIONS FOR THE NEXT FOUR AE SLIDES • We willstart at $500 equilibrium GDPon each. • Of the three items(equilibrium GDP, change • in expenditures, and MPC), you will be given • two and if you know two you can always figure • out the 3rd. For instance if you knew that • equilibrium GDP increased by $400 and the • multiplier was 4, then the change in expenditures • was obviously $100. • Except for 6, 9, 15, & 18, you will increase • equilibrium GDPabove $500, because there • is an increase in G, or a decrease in T, or • an equal increase in G&T. • Ex: With MPC of .75 & therefore a ME of 4, • an increase in G of $20 means $20 x 4 = $580 • 4. On questions 6, 9, 15, & 18, you will decrease equilibrium • GDP below $500 because you are either decreasing G, • increasing T, or there is an equal decrease in G & T. • Ex: With MPC of .75 & therefore a ME of 4, a decrease • in G of $20 means -$20 x 4 = $420. Inflationary spending gap AE AE2 AE1 AE3 E2 E1 E3 500 Recessionary spending gap Inflationary GDP gap Recessionary GDP gap
The Multiplier & Equilibrium GDP [Give the correct equilibrium GDP [start from $500] using the ME, MT, MBB] MT = MPC/MPS [Chg in T ] MBB = 1 [G&T ] ME=1/MPS [chg in G, Xg, or Xn] [+G] 1. ME = ____ [-T] 2. MT = ____ [+G&T] 3. MBB =____ 540 S 520 Inflationary Spending gap AE1 AE2 AE3 AE E2 520 E1 Chg in Equilibrium GDP ___ Y with ME ____Y with MT ____Y withMBB 40 E3 20 20 ME__ MT___ MBB___ 2 MPC [So MPS & ME, MT, & MBB] $20 Change in Expenditures $500 Recessionary Spending gap .50 1 1 [+G] 1. ME = ____ [-T] 2. MT = ____ [+G&T] 3. MBB =____ MT’s MPC M .90 = 9 .87.5= 7 .80 = 4 .75 = 3 .60 =1.5 .50 = 1 ME’s [G,Ig,Xn] MPC M .90 = 10 .87.5= 8 .80 = 5 .75 = 4 .60 =2.5 .50 = 2 [+G] 1. ME = ____ [-T] 2. MT = ____ [+G&T] 3. MBB =____ [+G] 1. ME = ____ [-T] 2. MT = ____ [+G&T] 3. MBB =____ 600 700 560 590 548 650 510 512 550 2 3 1 $100 Y with ME ___Y with MT ___Y withMBB $200 Y with ME _____Y with MT _____Y withMBB ____ Y with ME ____Y with MT ____Y withMBB 60 90 150 48 10 50 12 ME__ MT___ MBB___ ME__ MT___ MBB___ .9 10 5 ME__ MT___ MBB___ 4 $10 .80 $12 4 9 .75 3 $50 ? 1 1 1
[-G] 1. ME = ___ [+T] 2. MT =___ [-G&T]3.MBB=___ [+G] 1. ME = ____ [-T] 2. MT = ____ [+G&T] 3. MBB =____ [+G] 1. ME = ____ [-T] 2. MT = ____ [+G&T] 3. MBB =____ 600 550 460 550 465 530 550 520 495 4 5 ___ Y with ME ____Y with MT ____Y with MBB 50 6 100 ___ Y with ME ____Y with MT ____Y with MBB -40 ___ Y with ME ____Y with MT ____Y with MBB 30 50 -35 20 50 -5 .60 .50 87.5 2 2.5 ME__ MT___ MBB___ ME__ MT___ MBB___ 8 ME__ MT___ MBB___ $20 1 $50 1.5 7 -$5 1 1 1 [-G] 1. ME =___ [+T] 2. MT =___ [-G&T]3.MBB=___ 575 [+G] 1. ME = ____ [-T] 2. MT = ____ [+G&T] 3. MBB =____ [+G] 1. ME = ____ [-T] 2. MT = ____ [+G&T] 3. MBB =____ 300 900 560 320 800 515 480 600 7 8 9 -200 75 ___ Y with ME ____Y with MT ____Y with MBB ___ Y with ME ____Y with MT ____Y with MBB ___ Y with ME ____Y with MT ____Y with MBB 400 60 -180 300 15 100 -20 .80 .9 .75 5 10 ME__ MT___ MBB___ 4 ME__ MT___ MBB___ ME__ MT___ MBB___ $15 4 -$20 9 $100 3 1 1 1
[+G]1.ME= ___ [-T]2.MT=___ [+G&T]3.MBB=___ [+G] 1. ME = ____ [-T] 2. MT = ____ [+G&T] 3. MBB =____ [+G] 1. ME = ____ [-T] 2. MT = ____ [+G&T] 3. MBB =____ 540 625 550 538 540 575 502 550 510 10 11 ___ Y with ME ____Y with MT ____Y with MBB 125 12 40 ___ Y with ME ____Y with MT ____Y with MBB 50 ___ Y with ME ____Y with MT ____Y with MBB 75 38 40 50 2 10 .95 .60 ? ? 20 ME__ MT___ MBB___ 5 ME__ MT___ MBB___ 2.5 ME__ MT___ MBB___ $50 $2 $10 19 4 1.5 1 1 1 [-G] 1. ME =___ [+T] 2. MT =___ [-G&T]3.MBB=___ 560 [+G] 1. ME = ____ [-T] 2. MT = ____ [+G&T] 3. MBB =____ [+G] 1. ME = ____ [-T] 2. MT = ____ [+G&T] 3. MBB =____ 420 700 545 430 600 515 490 600 13 14 15 -80 60 ___ Y with ME ____Y with MT ____Y with MBB ___ Y with ME ____Y with MT ____Y with MBB ___ Y with ME ____Y with MT ____Y with MBB 200 45 -70 100 15 100 -10 87.5 .75 .50 8 4 ME__ MT___ MBB___ 2 ME__ MT___ MBB___ ME__ MT___ MBB___ $15 -$10 7 $100 3 1 1 1 1
[-G] 1. ME = ___ [+T] 2. MT =___ [-G&T]3.MBB=___ [+G] 1. ME = ____ [-T] 2. MT = ____ [+G&T] 3. MBB =____ 532 625 [+G] 1. ME = ____ [-T] 2. MT = ____ [+G&T] 3. MBB =____ 400 524 600 410 508 525 490 16 17 18 32 125 ___ Y with ME ____Y with MT ____Y with MBB -100 ___ Y with ME ____Y with MT ____Y with MBB ___ Y with ME ____Y with MT ____Y with MBB 24 100 -90 8 25 -10 .75 .80 .9 4 10 ME__ MT___ MBB___ 5 ME__ MT___ MBB___ ME__ MT___ MBB___ $8 $25 3 9 4 -$10 1 1 1
2000 1999 C = YD 1998 1997 1996 1995 1994 1993 1992 1991 1990 1989 1988 1987 1986 1985 1984 1983 1982 1981 1980 Actual consumer spending 45° U.S. Consumption and Income $7000 6000 5000 4000 CONSUMPTION (billions of dollars per year) 3000 2000 1000 0 $1000 2000 3000 4000 5000 6000 7000 DISPOSABLE INCOME (billions of dollars per year)
The Consumption Function:How large we expect the basic flow of consumer spending to be at different levels of GDP (income)
Dissaving During The Great Depression C/Y = $4,425/$4,800 = 92% 1993 Saving = $375.0 billion “C” = $4,425 “S” = $375 1929 – Saving = $4 bil. 1933 – Dissaving 1944 – Saving= 20%
Consumption Schedule [direct relationship between income & consumption] o 45 S $530 510 490 470 450 430 410 390 370 Consumption Consumption(billions ofdollars) o 370 390 410 430 450 470 490 510 530 550 Disposable Income(billions of dollars)
Equilibrium in a Closed-Private Economy Leakage (S of $20 B)= Injection (Ig of $20 B)