Download
1 / 36
410 likes | 682 Views
All separations go against the 2 nd Law of Thermodynamics: entropy increases during any natural process. Separation Science. 1. Metallurgy 2. Distillation 3. Isolation of Dyes. Ancient Separations. 1. Medical Technology 2. Petroleum & Polymers 3. Environmental Analysis.

E N D
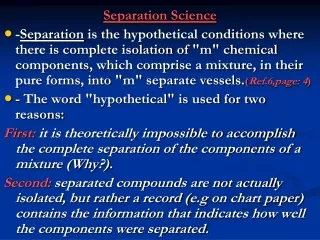
All separations go against the 2nd Law of Thermodynamics: entropy increases during any natural process Separation Science
1. Metallurgy 2. Distillation 3. Isolation of Dyes Ancient Separations
1. Medical Technology 2. Petroleum & Polymers 3. Environmental Analysis Modern Separations
1. gas-gas → 235UF6, 238UF6 2. gas-liquid → distillation 3. gas-solid → molecular sieves 4. liquid-liquid → extractions 5. liquid-solid → precipitation, SPE 6. solid-solid → sieving Phase Distributions Bring about most separations
Liquid-liquid extraction of an analyte based on its partitioning between two different liquid phases.
Solid Phase Extraction of an analyte in a liquid phase using a bed of packing material
Separation of 2 analytes A and B on a bed of packing material using a flowing liquid phase
1. Phase Equilibira: One of the phases is the analyte 2. Distribution Equilibria: The two phases are composed of compounds other than the analyte. 2 Categories of Separations
Given the complexity of many real samples, interferences between the analyte and concomitants are common. A logical approach is to reduce the possibility of interference by removing the concomitants. Distribution Equilibira
This is often achieved by placing the sample in a 2-phase system, and allowing the species to partition between the 2 phases. From this point of view, separation science may be considered a sample preparation technique. Distribution Equilibira
KD = [S]org / [S]aq = X/Y [S] is the concentration of the solute (or analyte) in the given phase at equilibrium X is the fraction of analyte in the organic phase Y is the fraction in the aqueous phase Partition Coefficient (or Distribution Coefficient or Ratio)
Suppose we have a volume of clean organic solvent in a separatory funnel. Organic Phase Aqueous Phase If we add an equal volume of water containing our analyte (C moles), what will happen?
Organic Phase Aqueous Phase The analyte will “partition” between the two phases depending upon its partition coefficient K. [S]org = XC X+Y=1 [S]aq = YC
Organic Phase Aqueous Phase In a successful separation, the analyte (A) and the concomitant (B) have very different partition coefficients: KA ≠ KB
Organic Phase Aqueous Phase In practice, this is seldom the case, or: KA ≈ KB So we may need to perform a series of extractions.
XC: Fraction in Organic Phase YC: Fraction in Aqueous Phase Perform a Series of identical extractions: After we allow the first extraction step to reach equilibrium, but before we remove the water layer…
Fresh Organic Fresh water YC YC XC Fresh water YC Now, we shift the aqueous phase: remove the lower layer and add fresh water to funnel #1… And then add the lower “aqueous” phase to a fresh organic layer in funnel #2.
Fresh water YC Organic Phase Organic Phase Organic Phase Aqueous Phase Aqueous Phase Aqueous Phase YC Shift 1 with a series of funnels
Total moles of analyte in each funnel at the end of shift #1 Organic Phase Organic Phase Organic Phase Aqueous Phase Aqueous Phase Aqueous Phase 0 YC XC
Organic Phase Organic Phase Organic Phase Aqueous Phase Aqueous Phase Aqueous Phase 0 YC XC Allow each funnel to equilibrate, and shift aqueous phases again (shift #2)… (Total Amount in each column)
Fresh water Y(XC) Y(YC) X(XC) X(YC) 0 Y(XC) Y(YC) 0 Y(XC) Y(YC) 0 Amount remaining in organic layer after equilibration Amount shifted with aqueous layer in next step
X(XC) X(YC) 0 0 Y(XC) Y(YC) 2XYC Y2C X2C Total moles of analyte in each sep. funnel at the end of shift 2. Amounts in each layer are allowed to combine… Funnel 1 Funnel 2 Funnel 3
And so on… After step 3: X3 3X2Y 3XY2 Y3 After 4: X4 4X3Y 6X2Y2 4XY3 Y4 After 5: X5 5X4Y 10X3Y2 10X2Y3 …
Let the funnel number be “n” And the shift number be “r” Then the fraction in funnel n after shift # r is given by: fn = r! Xr-n+1 Yn-1 (r-n+1)! (n-1)! If we observe what comes out of the last funnel (N = n+1) fN = r! Xr-N YN (r-N)! (N)!
So we could predict how an analyte will emerge from the system by plotting fN vs. r. Or we could predict the time, r, when the maximum amount of an analyte reaches the end by finding the derivative of the fraction with respect to r: dfN/dr = 0 Both problems are very hard to solve!
Luckily, this formula has already been solved by Bernoulli. A random experiment with 2 possible outcomes (X and Y) obeys this same formula. For example: X is the probability of heads Y is the probability of tails r is the number of tosses N is a particular number of observed heads fN is the probability that exactly N heads will be observed
This is known to be a binomial distribution and the mean is given by: n = rY and the variance is given by: σ = (rXY)1/2 So to get the maximum amount of analyte at the end requires rmax shifts where: rmax = N/Y And he spread of the analyte among the funnels is described by σ, where: σ = (rmax XY)1/2 = (NX)1/2
So this theory predicts that we should observe Gaussian shaped analyte distributions that elute in narrow tall peaks if the aqueous phase is preferred, or short broad peaks if the organic phase is preferred.
We may consider a chromatographic system as a “continuous” array of separatory funnels, or tiny plates. The total number of these plates in the system will be N, and they will be arranged in some real length L. So each individual plate will have some height H=L/N. This theory is known as “plate theory” and it won a Nobel Prize for Martin and Synge in 1952.
In a real chromatography system, a volume of solution is flowing at a known rate, so the number of shifts, r, is related to time. Therefore, we can measure a retention time, tr, defined as the time required between injection of an analyte, and the appearance of its maximum concentration at a detector (plate # N). And it should have a measurable width that depends upon KD.
One of the phases is mobile, or moves through the system, while the other is stationary. In our separatory funnel example, the mobile phase is aqueous, and the stationary phase is organic.
By convention, a “normal” mode of separation is one where the mobile phase is organic, and the stationary phase is polar. A “reversed phase” has a polar or aqueous mobile phase, and a non-polar stationary phase.
Plate Theory defines terms measurable based on Gaussian shaped curves: N = 16 (tr / W)2 = 5.54 (tr / W1/2)2 H = L/N A large number of plates, or a short plate height characterize more efficient separations.
Shortcomings of Plate Theory 1. Assumes equilibrium is established quickly 2. Ignores diffusion 3. Ignores relative volumes of the two phases