Download
1 / 14
140 likes | 235 Views

E N D
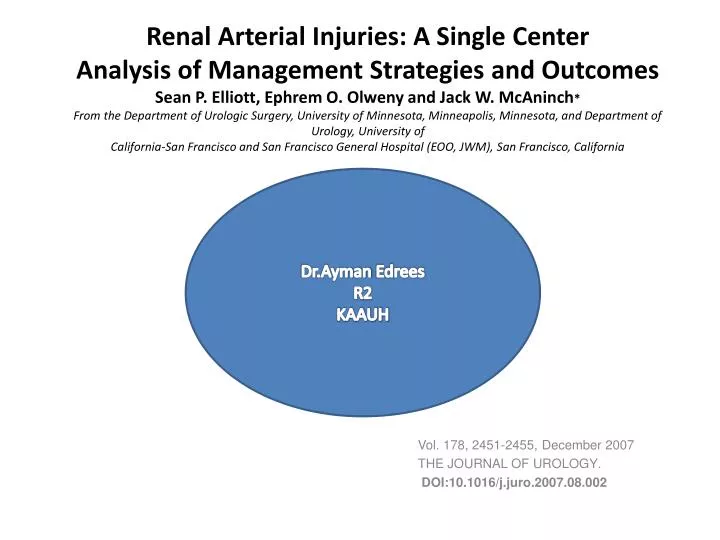
Renal Arterial Injuries: A Single CenterAnalysis of Management Strategies and OutcomesSean P. Elliott, Ephrem O. Olweny and Jack W. McAninch*From the Department of Urologic Surgery, University of Minnesota, Minneapolis, Minnesota, and Department of Urology, University ofCalifornia-San Francisco and San Francisco General Hospital (EOO, JWM), San Francisco, California Dr.AymanEdrees R2 KAAUH Vol. 178, 2451-2455, December 2007 THE JOURNAL OF UROLOGY. DOI:10.1016/j.juro.2007.08.002
Renal injury occurs in up to 1.2% of trauma cases in the United States. • Only 2.5% to 4% of these cases involves the renal vasculature • Renovascular injuries are associated with multiple non-renal organ injuries and with a high mortality rate of 19% to 44% • Management of main and segmental renal artery injury following external trauma is controversial • After main renal artery injury the controversy surrounds nephrectomy vs revascularization • whereas after segmental renal artery injury the debate involves operative vs nonoperative management
Data on a total of 82 renal artery injuries in 81 patients • collected between 1978 and 2006 • They were retrospectively reviewed • Patient demographics, length of stay, transfusion requirements and injury characteristics (artery subtype, grade, mechanism, and associated parenchymal, venous and nonrenal injuries) were recorded. • Management strategies and outcomes for each renal artery injury subtype were compared.
TABLE 1. Patient and injury characteristics MAI SRAI Totals No. pts (%) 36 (43) 45 (57) 81 Median age (range) 29 (15–74) 27 (4–68) 28 (4–74) No. males (%) 30 (41) 43 (59) 73 (90) No. females (%) 6 (14) 2 (5) 8 (10) No. trauma (%): Penetrating 20 (49) 21 (51) 41 (51) Blunt 16 (40) 24 (60) 40 (49) No. Parenchymal 21 (45) 26 (55) 47 (58) laceration (%) No. associated injuries (%) 34 (47) 38 (53) 72 (89) No. shock (%) 26 (57) 20 (43) 46 (57) No. hematuria/total 30/33 (91) 30/34 (88) 60/67 (90) No. (%): Gross 18/30 (60) 15/30 (50) 33/60 (55) Microscopic 12/30 (40) 15/30 (50) 27/60 (45) Absent 3/33 (9) 4/34 (12) 7/67 (10) Unknown 3/36 (8) 11/45 (24) 14/81 (17) No. RAIs (%): 36 46 82 Isolated arterial injury 16 (29) 39 (71) 55 (67) Combined arterial 20 (74) 7 (26) 27 (33) venous injury No. injury grade/total No. (%): 4 4/48 (8) 44/48 (92) 48/82 (59) 5 32/34 (94 ) 2/34 (6) 34/82 (41)
For main renal artery injury the respective outcomes of nephrectomy vs vascular repair were a mean transfusion of 10,275 vs 6,125 ml (p 0.39) • Length of stay 18 days for each, mortality rate 26% vs 13%, renal • Failure rate 8% vs 25% • Renal insufficiency/impaired selective function by renal scintigraphy 4% vs 13% (each p not significant).
TABLE 2. Outcomes of nephrectomy vs vessel repair for MRAI • Nephrectomy Vessel Repair p Value • No. pts 23 8 • Mean SD transfusion requirement (ml) 10,275 12,871 6,125 5,393 0.39 • Mean SD LOS (days) 17.9 22 18.3 21 0.97 • No. death during hospitalization (%) 6 (26) 1 (12.5) 0.4 • No. renal failure (%) 2* (8) 2 (25) 0.29 • No. hypertension 1* 0 0.57 • No. renal insufficiency (Cr mg/dl 1.5 or greater) or impaired renal function 1 (4) 1 (12.5) 0.47 • 40% or less by renal scan (%) • No. other renal related complications during hospitalization (%)† 1 (4) 0 0.57 • No. nonrenal nonfatal complications during hospitalization (%) 4 (17) 0 0.28 • No. uneventful hospitalization, lost to followup (%) 6 (26) 2 (25) 1 • No. no sequelae, Cr 1.5 mg/dl or less at followup 3 (13) 2 (25) 0.59 • The patient who underwent bilateral renovascular surgery had hypertension associated with renal failure. • †Eg infection
For segmental renal artery injury operative vs nonoperative management was associated with a mean transfusionof 4,994 vs 820 ml (p 0.01) • Length of stay 29 vs 11 days (p 0.23) and mortality rate 8% vs 6% (p 1.0). • Renal failure and impaired selective renal function on scintigraphy were similar between the groups.
TABLE 3. Outcomes of operative vs nonoperative SRAD management OperativeNonoperative p Value No. pts 24 18 Mean SD transfusion requirement (ml) 4,994 6,016 820 903 0.01 Mean SD LOS (days) 29.3 59 11.3 12 0.23 No. death during hospitalization (%) 2 (8) 1 (6) 1 No. renal failure (%) 2* (8) 0 0.5 No. hypertension (%) 1* 1 (6) 1 No. renal insufficiency or impaired renal 2 (8) 3 (16) 0.65 function 40% or less by renal scan (%) No. persistent urinoma requiring intervention (%) 0 1 (6) 0.46 No. renal related complications during hospitalization (%)† 1 (4) 0 1 No. nonrenal nonfatal complications during hospitalization (%) 4 (17) 0 0.12 No. uneventful hospitalization, lost to followup (%) 6 (25) 9 (50) 0.11 No. no sequelae, Cr 1.5 mg/dl or less at followup (%) 7 (29) 3 (16) 0.46 * The patient who underwent bilateral renovascular surgery had hypertension associated with renal failure. † Excluding urinoma.
Nephrectomy for main renal artery injury has outcomes similar to those of vascular repair and it does not worsen posttreatment renal function in the short term • Nonoperative management for segmental renal artery injury results in excellent outcomes.