Download
1 / 30
300 likes | 488 Views
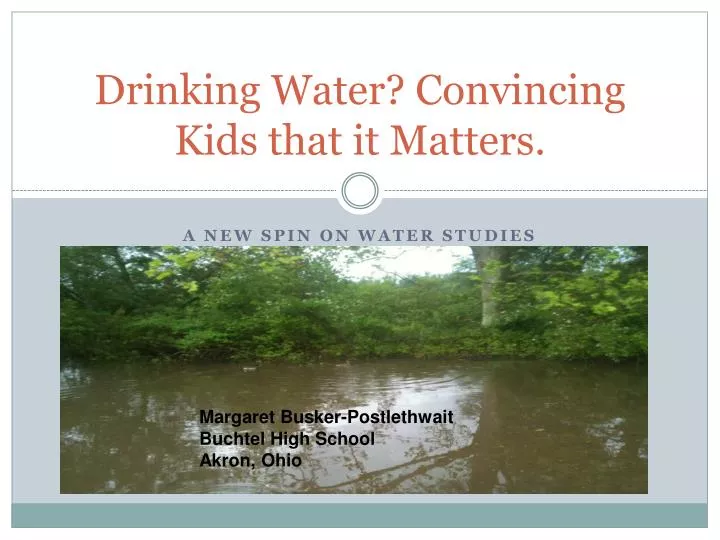
Drinking Water? Convincing Kids that it Matters. A new spin on water studies. Margaret Busker-Postlethwait Buchtel High School Akron, Ohio. Overview. Background – Distribution Systems and Drinking Water Quality Review of Akron, OH Drinking Water System

E N D
Drinking Water? Convincing Kids that it Matters. A new spin on water studies Margaret Busker-Postlethwait Buchtel High School Akron, Ohio
Overview • Background – • Distribution Systems and Drinking Water Quality • Review of Akron, OH Drinking Water System • Student Activities-Demonstrations • Resources
Background Information Drinking water in cities mainly comes from a reservoir or aquifer. Surface water-biological pollutants Ground water-possible leachates
What’s so special about this Unit? • Students care about the water they actually drink • Many “problems” (science and social) with drinking water to investigate and use to drive learning • Unfortunately there are very few experiments or demonstrations examining the relationship between drinking water quality and the distribution system. . . . . . . . . until now . . . . . • Most focus on watershed, which is important, but does NOT possess final characteristics of the water we drink • Water Treatment Plant primary function – reduce organics in water, reduce turbidity, and add disinfectant at plant • For drinking water, critical items-regulations are human health issues (heavy metals and disinfection byproducts) – how does the distribution system impact water quality?
According to USGS: In the United States, more than 250 million people depend on the fresh water in our rivers, lakes, streams, and groundwater supplies for their drinking water.
Water: From Reservoir to Tap Water Distribution System Reservoir (Lake Rockwell) Watershed (Cuyahoga) Homes Treatment Plant (city of Akron)
Distribution Systems 101 • There are general relationships between: • distance from water plant and water age • water age and chlorine residual • water age and DBPs Chlorine residual measurement of tap water gives us a lot of information!
Water comes from a reservoir called Lake Rockwell. Lake Rockwell is fed by the Cuyahoga River which comes from Lake Erie. The Cuyahoga River begins and ends in Lake Erie. Akron’s Wastewater Treatment plant also uses the Cuyahoga River for it’s discharge. Akron City Water
Water supply schematic This is from the State’s EPA site. The information in the TMDL (total maximum daily load) reports can be very useful. In this schematic students can see that their drinking water reservoir also is linked to other community’s waste water systems further up stream. A good way to create discussion about our impact on other watersheds. http://www.epa.ohio.gov/portals/35/tmdl/MidCuyFinalTMDL.pdf
Distribution System Basics • Distribution System consists of: • Pumps that deliver water from the water plant to storage tanks in the city • Pipes that deliver water from storage tanks to homes and businesses • Distribution System provides: • Water to meet demands (quantity and pressure) of homes and businesses • Water quality that meets Federal regulations Be careful – some cities use booster chlorination! Booster chlorination is addition of chlorine at another point in system (in addition to the water plant). It is not very common.
Drinking Water Quality 101 • Disinfectwith chlorine (added at water plant) to prevent biological contamination-waterborne diseases • Chlorine decays (i.e. goes away) in the distribution system • Chlorine reacts with dissolved organic matter (from natural sources) to form disinfection byproducts (DBPs) • DBPs are known carcinogens and regulated in the drinking water system • DBPs much, much lower if a groundwater source!
The Unit Pre-assessment Guskey Cycle (teach, re-teach, enrichment) CSR- Collaborative Strategic Reading Notes on Water (reading road map) Guided reading Water testing Assessment Enrichment
Keys to success Know your students- this was NOT the first lab I did- I got them excited about it in September and we did it later. Do guided reading activities with them prior to this so that they know how to read and answer questions. Be flexible Invite guest speakers in- I had rangers from Akron Water Pollution Division, Akron’s Waste Water Treatment Plant, Enviroscience, and Soil and Water Conservation District. Let them know how expensive and cool the test equipment is! Give them a period of 2-3 days to bring in water samples (you can’t test them all in one class period anyway) • GUSKEY CYCLE • Pre-test • Teach • Assess (80% is mastery) • Enrichment/re-teach • Re-test
Activities • Testing group • Testing their water sample with instructor • Plotting their results on city map • Drawing conclusions about levels of chlorine vs. DBP’s and age of water • Answering conclusion questions • Reading group • Reading water quality reports • Answering questions which are based on Bloom’s taxonomy • Interpreting data
What it looks like Students testing their water sample and completing their guided reading using the Akron Water Treatment Brochure . sample work
Water Testing-Indy Style Indianapolis receives its water from the Geist Reservoir which is fed from the Fall Creek. Chlorine is added at the treatment plant and is not typically “boosted”
Activities • Testing group • Testing their water sample with instructor • Plotting their results on city map • Drawing conclusions about levels of chlorine vs. DBP’s and age of water • Answering conclusion questions • Reading group • Reading water quality reports • Answering questions which are based on Bloom’s taxonomy • Interpreting data
Indianapolis The Geist Reservoir is the main source for Indianapolis This information is available on line in almost every city through the local public works.
Water will be coming in from reservoir entering city from the north. Water is pumped throughout the grid system.
Indianapolis Drinking Water The amount of chlorine (as sodium hypochlorite, or bleach) that is added at the plant will depend on many factors, including the flow through the plant and the temperature of the water. Citizens initially measures chlorine at the treatment plants, then again throughout the distribution system to ensure that sufficient chlorine remains in the water at the “ends” of the system. There are a couple of locations where additional chlorine can be added (again as bleach), but in general, we try to manage chlorine levels by ensuring that the water is used by customers. Ann McIver Citizens Water Group
Indianapolis Documents http://www.citizenswater.com/WaterQuality/TreatingDrinkingWater.aspx Mapquest
Data Collection Locate the water sample location on the map of the city. Write your data on a “sticky” and place it on the location.
Data Analysis Which samples had higher Chlorine levels? Which samples had lower Chlorine levels? What can we infer about DBP’s and Distance from Water treatment plant?
Conclusions Is chlorination harmful or helpful? What about ground water? Because chlorination is used kill bacteria, what can we do in order to decrease the need for chlorination? Other thoughts? Can this be used in any classroom?
Resources HACH (www.Hach.com): ~$400 for pocket colorimeter (chlorine only) and ~$700 for Model DR/820 (20+ water quality measurements), and~$0.20 per sample Your City website (look under Utilities) CCR (Consumer Confidence Reports) – all cities have them, a standard report on water quality for regulated parameters Google Maps (City) OhioEPA (www.OhioEPA.gov) Public drinking water systems information Watersheds-water quality