Download
1 / 14
140 likes | 147 Views
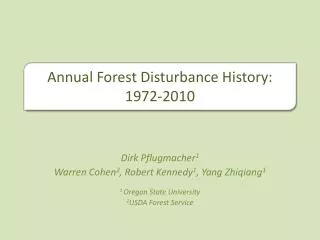
Solid State MAS-NMR for characterizing uranium minerals produced during dissolution of spent nuclear fuel. Beng Thye Tan 1 , Robert Baker 2 , Ian Farnan 1 1 Department of Earth Sciences, University of Cambridge, 2 Department of Chemistry, Trinity College, Dublin. Rationale.

E N D
Solid State MAS-NMR for characterizing uranium minerals produced during dissolution of spent nuclear fuel BengThye Tan1, Robert Baker2, Ian Farnan1 1Department of Earth Sciences, University of Cambridge, 2Department of Chemistry, Trinity College, Dublin
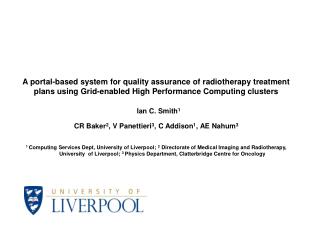
Rationale Migration of uranium and other actinides from underground repositories will depend on the minerals1 formed when spent nuclear fuel reacts with groundwater containing soluble ions in the anoxic2 environment of the repository. Secondary phases of possible uranium minerals were fabricated to develop a better understanding of their chemical structure. Although these are oxic fabrication, but they could occur under anoxic conditions if there was local oxidation due to water radiolysis. Spent Fuel Pool [1] R. J. Baker, Coord. Chem. Rev., 2014, 123-136 [2] Amme, M., Wiss et al, J. Nuc. Mat., 2005 341, 209-233. For the bentonite-canister near field, redox potentials of about -100 to -300 mV (SHE) are estimated.
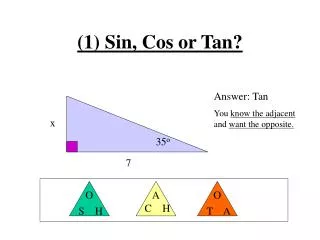
Existing XRD literature • Structural analysis of minerals from XRD literature with Crystalmaker™, • measuring the uranyl (U=O) bond lengths • comparing the angles. • the different oxygen environment can be examined
A typical structure: StudtiteDifferent oxygen environments O1 = U = O2 (Linear Uranyl ions- UO22+) O3-O31 (Peroxide ions O22-) H-O-H (Water molecule, H2O) * * * * * * * * * * NMR Spectrum of Studtite with a single uranyl peak. * Spinning sidebands O=U=O O-O H-O-H
MAS-NMR Analysis • 30- 35 mg of each sample was loaded into zirconia rotors in an anoxic glovebox. • 17O Nuclear Magnetic Resonance (NMR) spectroscopy was conducted with a 9.39 T magnetic field with rotor spinning at 18 kHz at a small pulse angle8 of about 100. Without spinning, poor resolution spanning 5000 ppm
Fabrication The shifting and broadening is related to the isotopic disorder of the crystal lattice. Fabrication and isotopic enrichment with NMR-sensitive 17O to characterize these samples. a) Andersonite3, Na2Ca(UO2)(CO3)3 · 6H2O b) Becquerelite4, Ca(UO2)6O4(OH)6 · 8H2O c) Grimselite5, K3Na(UO2)(CO3)3 · H2O d) Metaschoepite6, (UO2)4O(OH)6 · 5H2O e) Studtite7, [(UO2)(O2)(H2O)2] · 2H2O Shifted oxygen peak Fig 1. Raman spectroscopies of Becquerelite formed with normal H2O and H217O with a shifted oxygen peak, demonstrating the successful isotopic enrichment Emission and Raman spectroscopies show the same peaks. The peak corresponding to oxygen element (750 cm-1) is higher due to the heavier 17O atom. This demonstrated the successful isotopic enrichment of the mineral. Emission and Raman spectroscopies show the same peaks. The peak corresponding to oxygen element (750 cm-1) is higher due to the heavier 17O atom. This demonstrated the successful isotopic enrichment of the mineral. Emission and Raman spectroscopies show the same peaks. The peak corresponding to oxygen element (750 cm-1) is higher due to the heavier 17O atom. This demonstrated the successful isotopic enrichment of the mineral. Emission and Raman spectroscopies show the same peaks. The peak corresponding to oxygen element (750 cm-1) is higher due to the heavier 17O atom. This demonstrated the successful isotopic enrichment of the mineral. Emission and Raman spectroscopies show the same peaks. The peak corresponding to oxygen element (750 cm-1) is higher due to the heavier 17O atom. This demonstrated the successful isotopic enrichment of the mineral. Emission and Raman spectroscopies show the same peaks. The peak corresponding to oxygen element (750 cm-1) is higher due to the heavier 17O atom. This demonstrated the successful isotopic enrichment of the mineral. Emission and Raman spectroscopies show the same peaks. The peak corresponding to oxygen element (750 cm-1) is higher due to the heavier 17O atom. This demonstrated the successful isotopic enrichment of the mineral. Emission and Raman spectroscopies show the same peaks. The peak corresponding to oxygen element (750 cm-1) is higher due to the heavier 17O atom. This demonstrated the successful isotopic enrichment of the mineral. Shifted oxygen peak Fig 1. Oil bath for heat treatment and reaction of H217O Becquerelite Fig 1. Oil bath for heat treatment and reaction of H217O Becquerelite Fig 1. Oil bath for heat treatment and reaction of H217O Becquerelite Fig 1. Oil bath for heat treatment and reaction of H217O Becquerelite Fig 1. Oil bath for heat treatment and reaction of H217O Becquerelite Fig 1. Oil bath for heat treatment and reaction of H217O Becquerelite Fig 1. Oil bath for heat treatment and reaction of H217O Becquerelite Fig 1. Oil bath for heat treatment and reaction of H217O Becquerelite Fig 2. Raman spectroscopies of Becquerelite formed with normal H2O and H217O Fig 2. Raman spectroscopies of Becquerelite formed with normal H2O and H217O Fig 2. Raman spectroscopies of Becquerelite formed with normal H2O and H217O Fig 2. Raman spectroscopies of Becquerelite formed with normal H2O and H217O Fig 2. Raman spectroscopies of Becquerelite formed with normal H2O and H217O Fig 2. Raman spectroscopies of Becquerelite formed with normal H2O and H217O Fig 2. Raman spectroscopies of Becquerelite formed with normal H2O and H217O Fig 2. Raman spectroscopies of Becquerelite formed with normal H2O and H217O Fig 2. Raman spectroscopies of Becquerelite formed with normal H2O and H217O
Fabrication seems to favor non-uranyl oxygen. Grimselite • 1 uranyl peak at about 1100 ppm • a strong quadrupolar interaction at about 250 ppm • indicates the presence of more than one 17O environment. Andersonite • 2 uranyl peaks at about 1100 ppm. • 2 unique uranyl bond lengths of 1.7763 Å and 1.8078 Å that are separated by a chemical shift of 47.3 ppm • good resolution with a gradient of 150 ppm/ 0.1 Å O=U=O O=U=O * * * * * * * *
For more complicated structure with multiple uranyl bonds of different lengths, we can deconvolve them to resolve the isotropic chemical shifts corresponding to different oxygen environments. * Increased Proximity of uranium atom (shorter bond length) Shielding of Oxygen Nucleus (Smaller ppm values) * * * * * *
* * * Centre isotropic band * * * * * * * * * Spinning sideband manifold, separated by the spinning speed in frequency unit
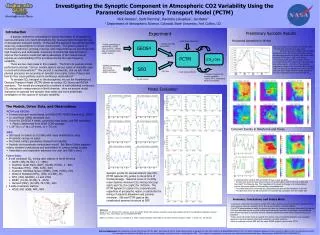
Fig 11. Graph of Chemical Shift/ ppm against Uranyl Bond Length/ Angstrom
Work in progress: "First principles methods using CASTEP" Gauge Including Projector Augmented Waves (GIPAW) was employed to calculate NMR spectroscopy on our samples. This program calculates the electric field gradients and chemical shielding tensors due to the surrounding atoms of the oxygen atom on a first-principal basis. Prior to that, we geometrically optimise the crystal structure by reducing the force per unit atom. This also position the hydrogen atoms in the water molecules as well, which are often absent in XRD data.
Conclusion Recent theoretical Ab Initio Molecular Dynamics Calculation9 on uranyl solution (140 ppm shift/ 0.1 Å) agrees with our experimental data. With 17O NMR, we obtain high resolution information on the oxygen environment in alteration phases of UO2, and we are beginning to get systematic data on variation of structure with chemical shift that will allow interpretation of amorphous phases. There is potential to investigate the inclusion of other actinides into these uranyl alteration phases. [9] Alex Marchenko et. al., Inorganic Chemistry, 2017, 56, 7384-7396