Download
1 / 24
260 likes | 448 Views
Clinical Assessment of Behavior. Bruce A. Bracken, Ph.D. The College of William and Mary Williamsburg, VA (USA) Babrac@wm.edu. Problem Statement.

E N D
Clinical Assessment of Behavior Bruce A. Bracken, Ph.D.The College of William and MaryWilliamsburg, VA (USA) Babrac@wm.edu
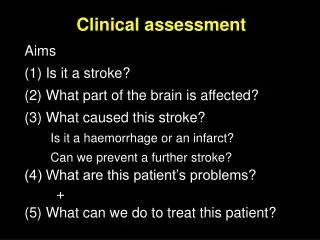
Problem Statement • To what extent are children’s and adolescents’ positive (i.e., adaptive) and negative (i.e., clinical) behavior ratings a result of basic demographic conditions (e.g., age, gender, race/ethnicity)? • Are children’s behavioral ratings comparably reliable as a result of these basic demographic conditions? • What percent of the variance in children’s behavioral ratings is associated with basic demographic conditions? • To what extent do children’s behavioral ratings differ as a result of race/ethnicity and gender?
Method • Students’ behaviors were rated by their mothers or fathers during the standardization of a new behavior rating scale, Clinical Assessment of Behavior (Bracken & Keith, 2004). • Students’ positive and negative (i.e., clinical) behaviors were compared directly (i.e., mean score comparisons) and indirectly (e.g., percent of variance accounted for by demographic variables; internal consistency estimates)
Instrument • Clinical Assessment of Behavior (CAB; Bracken & Keith, 2004). • Third-party behavior rating scale completed by parents and teachers (Parent form used in this study) • Appropriate for children ages 2 - 18 years • Assesses Clinical behaviors (Psychopathology, sociopathy, educational exceptionalities) and Adaptive behaviors • Used as triangulating element in multi-source, mult-instrument clinical assessments
Triangulation:Multi-source, Multiple Context Assessment Other Sources- Direct Observation - Indirect Approaches (e.g., Projective Techniques) - Background Information Behavioral and Psychosocial Adjustment Self-Report- Self-concept - Sentence Completion Forms Third-Party Report- CAB Parent or Teacher- BASC, DSMD, SSRS Achenbach, Connors
CAB Assesses: • Critical Behaviors: low-incidence behaviors that define serious psychopathology and sociopathy • Psychotic experiences (e.g., hallucinations) • Substance abuse • Satanic worship • Gang-related behaviors • Behaviors exhibited in medical and neuropsychological conditions • Attention-deficit/hyperactivity disorders • Learning disabilities • Executive function strengths and limitations • Autistic spectrum behaviors
CAB Assesses: • Behaviors that correspond to educational exceptionalities and conditions • Mental retardation • Learning disabilities • Gifted and talented • Adaptive behaviors • Social skills • Behaviors of current societal concern • Aggression • Anger management • Bullying • Conduct problems
Clinical Scales Internalizing Behaviors Scale (INT) • Assesses behaviors directed toward self (e.g., depression, anxiety, somatization, fear)- cries easily; is easily startled; is emotionally fragile Externalizing Behaviors Scale (EXT) • Assesses problematic conduct directed toward others (e.g., rule-breaking behaviors, vandalism, truancy)- insults others; is difficult to manage; ignores rules Critical Behaviors Scale (CRI) • Assesses behaviors associated with serious psychopathology and sociopathy- uses illegal drugs; hallucinates; expresses an unusual interest in Satan
Adaptive Scales Social Skills Scale (SOC) • Assesses interpersonal relations with peers and adults- listens attentively to others; is considerate of others; annoys others Competence Scale (COM) • Focuses on ability to get needs met appropriately, learning, and cognitive and language development- has poor judgment; is easily confused; learns new things easily Adaptive Behaviors Scale (ADB) • Assesses developmental progress and degree of personal independence- dresses self; reliably makes simple purchases; prepares simple meals for self
CAB Scale Structure and Number of Items Scale CAB-PX CAB-P CAB-T Clinical Scales Internalizing 30 16 16 Externalizing 30 18 18 Critical Behaviors 30 -- -- Adaptive Scales Social Skills 30 18 18 Competence 30 18 18 Adaptive Behaviors 20 -- -- Total Scale 170 70 70
CAB Clusters and Number of Items Clusters CAB-PX CAB-P CAB-T Clinical Clusters Anxiety 23 11 11 Depression 36 16 16 Anger 15 9 9 Aggression 25 13 13 Bullying 36 13 13 Conduct Problems 28 8 8 Attention Deficit/Hyperactivity 21 20 20 Autistic Spectrum Behaviors 30 13 13 Learning Disability 23 15 15 Mental Retardation 25 12 12 Adaptive Clusters Executive Function 17 13 13 Gifted and Talented 27 17 17
U.S. Normative Sample Sample Size Males Females Total Parent Forms- ages 2 – 6 309 291 600 - ages 7 – 12 455 422 877 - ages 13 – 18 318 319 637 Teacher Form- ages 5 – 6 145 95 240 - ages 7 – 12 471 288 759 - ages 13 – 18 391 299 690 Race/Ethnicity (Percent Representation) Whites Blacks Hispanics Other 65 – 71% 12 – 17% 9 – 12% 6 – 8%
Normative Sample Education Level CAB-P CAB-T < 11 years 3.9% 3.2% 12 years 23.9% 2.5% 13 - 15 years 38.7% 11.4% 16 years 14.6% 17.5% > 17 years 18.8% 65.2% Unknown 0.1% 0.2% Geographic Region Midwest 21 – 25% 17 – 22% Northeast 13 – 22% 22 – 25% South 35 – 45% 36 – 39% West 19 – 22% 17 – 20%
CAB PX Stability Scale CAB-PX Internalizing .89 Externalizing .90 Critical Behaviors .77 Social Skills .92 Competence .92 Adaptive Behaviors .87 CAB Behavioral Index .94 CAB Clusters .83 - .94
CAB Inter-raterCoefficients Scale CAB-PX* Internalizing .78 Externalizing .81 Critical Behaviors .41 Social Skills .62 Competence .79 Adaptive Behaviors .53 CAB Behavioral Index .82 CAB Clusters .70 - .90 * Parent - Parent
Analyses • Estimates of total scale internal consistency by race • Estimates of percent scale variance accounted for by basic demographic variables • Scale and cluster mean score comparisons for basic demographic variables
Comparative Reliabilities by Ethnic Group, Across Age Levels Caucasian African-American Hispanic Clinical Internalizing .94 - .95 .93 - .96 .91 - .96 Externalizing .96 - .97 .96 - .97 .93 - .98 Critical Behaviors .71 - .92 .80 - .98 .42 - .92 Adaptive Social Skills .92 - .96 .92 - .95 .89 - .96 Competence .91 - .95 .92 - .95 .89 - .97 Adaptive Behavior .79 - .89 .82 - .90 .84 - .89 Total ScaleCBI .97 - .99 .98 - .99 .96 - .99 Clusters .84 - .97 .85 - .97 .78 - .97
Scale Variance AssociatedWith Demographic Variables Age Gender Race Parent Ed Clinical Internalizing .35 .08 .59 .21Externalizing .19 2.82 .01 .42Clinical Behaviors 4.93 .53 .36 .72 AdaptiveSocial Skills 1.44 2.69 .03 .67Competence 2.69 2.96 .01 .81Adaptive Behaviors 49.70 1.80 .01 .03 Total Scale (CBI) 2.86 2.31 .01 .61
Cluster Variance AssociatedWith Demographic Variables Age Gender Race Parent Ed Anxiety .00 .35 .26 .22 Depression .71 .40 .37 .29 Anger .79 2.07 .32 .45 Aggression 1.37 4.45 .10 .67 Bullying .49 2.34 .00 .58 Attention Deficit .90 3.84 .03 .42 Autistic Spectrum 5.15 1.72 .00 .61 Learning Disability .46 2.19 .00 .58 Mental Retardation 12.60 2.86 .04 .77 Executive Function 2.76 4.16 .00 .57 Gifted and Talented 3.10 3.46 .06 .94
Scales p Clusters p Anxiety (ANX) ns Internalizing Behaviors (INT) ns Depression (DEP) ns Externalizing Behaviors (EXT) ns Anger (ANG) ns Aggression (AGG) ns Critical Behaviors (CRI) ns Bullying (BUL) ns Conduct Problems (CP) ns Social Skills (SOC) ns Attention-Deficit (ADH) ns Competence (COM) ns Autistic Spectrum (AUT) ns Learning Disability (LD) ns Adaptive Behaviors (ADB) ns Mental Retardation (MR) ns Executive Function (EF) ns Total (CBI) ns Gifted and Talented (GAT) ns Gender DifferencesMain Effect for Gender by Race ANOVA(No significant gender by race interactions)
Scales p Clusters p Anxiety (ANX) .05 Internalizing Behaviors Whites > Blacks .05 Depression (DEP) .05 Externalizing Behaviors ns Anger (ANG) ns Aggression (AGG) ns Critical Behaviors .05 Bullying (BUL) ns Social Skills ns Conduct Problems (CP) ns Attention-Deficit (ADH) ns Competence ns Autistic Spectrum (AUT) ns Adaptive Behaviors ns Learning Disability (LD) ns Total (CBI) ns Mental Retardation (MR) ns Executive Function (EF) ns Gifted and Talented (GAT) ns Race/Ethnicity Differences**Main effect for Race/ethnicity, with no interactionsOnly INT revealed differences on post hoc analyses due to conservative nature of Scheffe
Conclusions • Minimal variance in clinical and adaptive behaviors due to basic demographic variables (except age in developmental conditions - - adaptive behavior) • CAB produces minimal mean score differences as a result of basic demographic variables (gender, race/ethnicity) • Behaviors assessed by the CAB, both adaptive and pathological, appear to be normally distributed within the greater population. • CAB appears to produce highly reliable assessment of the behavior of youth regardless of age, race, or gender