Download
1 / 55
550 likes | 630 Views
Volume Graphics and the Internet. Ken Brodlie and Jason Wood School of Computer Studies University of Leeds. Internet. The Internet brings connectivity Connectivity means… humans can collaborate systems can collaborate. Why Collaborative Visualization?.

E N D
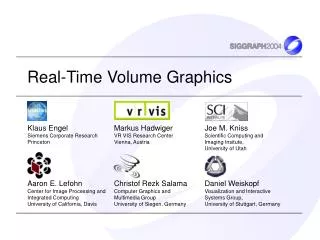
Volume Graphics and the Internet Ken Brodlie and Jason Wood School of Computer Studies University of Leeds
Internet • The Internet brings connectivity • Connectivity means… • humans can collaborate • systems can collaborate
Why Collaborative Visualization? • Visualization IS a collaborative activity! • Scientific research is carried out in multi-disciplinary teams • each person brings individual skills • teams may be geographically distributed • Influence of the Internet and Web • collaborative culture • BUT existing visualization systems: • single user model and pre-Web
How Can We Collaborate? • General application sharing • one host acts as master, broadcasts screen display to other participants • collaboration at the operating system level • SharedX, MS NetMeeting • high bandwidth requirement • Collaborative visualization systems • use knowledge of application to get a better solution
Collaborative Visualization - Outline of First Part of Talk • Influences • other work on collaborative visualization • Concept • linked dataflow • Realisation • IRIS Explorer COVISA toolkit • Application • collaboration in volume visualization
Rendering workstation Interview Tempus Fugit - Sharing Geometry • CFD visualization system developed by Michael Gerald-Yamasaki at NASA Ames - Eurographics 93 workstation Simulation Visualization Rendering Geometry list supercomputer
In the EU PAGEIN project, Michel Grave at ONERA developed a ‘shared interface’ approach Parameters to be shared extracted into a shared interface above the visualization system ONERA - Sharing Control
Extension of Alex Pang’s Spray rendering Particles fired into data with specific objective - eg locate isosurface In CSpray, each person has a spray can Careful study of issues floor control privacy audit trail CSpray - Collaboration Issues
COVISA Research Objective • Our aim was to evolve a collaborative extension of Modular Visualization Environments • IRIS Explorer, AVS, IBM Data Explorer, Khoros • usability: keep same metaphor • sharing: share data and control with other participants • flexibility:program the collaboration to allow network efficiency, privacy, join-at-any-time
simulation INPUT DATA FILTER MAP RENDER measurement image filtered data geometry (surface/volume) Back to the Visualization Reference Model • To design a collaborative visualization system, we return to the underlying Haber-McNabb reference model - and think how to extend it:
INPUT DATA FILTER MAP RENDER INPUT DATA FILTER MAP RENDER Collaborative Dataflow Model
INPUT DATA FILTER MAP RENDER SHARE PARAM SHARE PARAM ADVISOR Internet INPUT DATA SHARE DATA SHARE DATA FILTER MAP RENDER Collaborative Dataflow Modules
senior scientist INPUT DATA FILTER MAP RENDER ADVISOR Internet INPUT DATA FILTER MAP RENDER junior scientist Use My Network...
senior scientist INPUT DATA FILTER MAP RENDER SHARE PARAM SHARE PARAM ADVISOR Internet INPUT DATA FILTER MAP RENDER junior scientist See What I Can See...
INPUT DATA FILTER MAP RENDER ADVISOR Internet SHARE DATA SHARE DATA RENDER See What You Can See...
INPUT DATA FILTER MAP RENDER ADVISOR Internet SHARE DATA SHARE DATA MAP RENDER Do Your Own Thing...
ADVISOR Internet SHARE DATA SHARE DATA SHARE DATA SHARE DATA Can I Use Your Expertise? INPUT DATA FILTER RENDER MAP
IRIS Explorer COVISA Toolkit • This research is now available as the COVISA add-in to IRIS Explorer • Advisor, ShareParam, ShareData modules... • ...wired in to networks exactly like any other • See IRIS Explorer Centre Web Site: • http://www.scs.leeds.ac.uk/iecoe
Collaborative Modules • Modules can be written as directly collaborative • for example, MSharePointer
Collaborative Applications • End-user applications can be built as a layer on top of a dataflow network • selected parameters exposed to users in a simple interface • collaboration can be included in these
Application • Video will show application to volume visualization • Radiologist studying abdominal aortic aneurysm.. • … collaborates with a medical physicist with segmentation skills
Visualization and the World Wide Web • Early use for descriptive visualization • visualize using conventional software such as MVEs • publish as an image, or as 3D VRML model • Now used also for analytical or exploratory visualization • visualization process executed as a Web-based application • Web-based visualization has become an established branch of discipline
How Did It Start? • Pioneering work by Ang et al 1994 • medical volume visualization system VIS used as a client-side application linked to Mosaic browser • invoked on receipt of MIME-type ‘hdf/volume’ • Server-side example from Wood 1995 • air quality visualization service • IRIS Explorer on server, returning VRML • Now many styles of web-based visualization • some client-based, some server-based
Action is at the client Three flavours according to what is sent from the Web server: raw data script to drive software software Web server Browser Client-based Systems
Vis5D: for meteorological visualization, from Hibbard at Wisconsin Configured as helper application, invoked on receipt of MIME-type ‘application/vis5d’ Daily weather forecasts Sending data - Vis5D
Client-based system with IRIS Explorer developed by Alan Yeo and Jason Wood at Leeds Set of instructions downloaded from server to ‘program’ IRIS Explorer on the client Instruction file invokes application which drives IE Sending a Script : Client-Explorer
VizWiz is Java applet for volume visualization, from Michaels & Bailey at SDSC Data is a problem: must be uploaded from client to server to work around Java security issues Sending Software : VizWiz
Action is at the server Three flavours according to what is sent from the server: 3D graphics 3D graphics plus software images / video Web server Browser Server-based Systems
Air quality web-based visualization system with IRIS Explorer on server, developed by Jason Wood User completes form saying what data, and what technique CGI script invokes IRIS Explorer VRML returned Sending VRML : Air Quality Visualization Service
Engel and colleagues at Erlangen have implemented their progressive isosurface algorithm as a web-based system Sending VRML and Java: Isosurfacing
Texture-based volume rendering can be delivered as VRML This VRML volume rendering developed by Nigel John and colleagues at SGI Biomedical Java applet provides interaction Sending VRML and Java:Volume Rendering
Sending Images/Video: Volume Render • Rather than render on the client, it is possible to render on a server and ship the images to the client… • … this approach has been used by Stredney et al at Ohio for remote volume rendering • Client uploads data to server (with 3D texture hardware)
Client-based high interactivity needs software availability at client, plus skill to use it needs compute power at client… but this is dedicated Server-based low degree of control software provided by server compute power provided by server … but shared between many Review
Extending to Collaborative Web-based Visualization • Both client and server based systems can be extended to collaborative style of working - although surprisingly little work has been done in this area
Client-based Systems • FASTexpeditions can run in a pilot-passenger mode • ClientExplorer can be extended to incorporate the COVISA shared modules • VisAD has been used in a collaborative setting, with NCSA Habanero
Air quality visualization service (IRIS Explorer on server) has been extended to support asynchronous collaboration Server-based Systems
Collaborative Web-based Visualization • Future direction could be combination of synchronous collaboration provided by the extensions of MVEs described earlier • …and the asynchronous collaboration for which the Web is well suited, providing a sustainable environment for collaboration
S S C C C C Reference Model - The Processes Setup Base Software Render Design Input Data Script
Design executed on client-side SetUp Base Software Design C Render Data Script Client-based Systems
All components except the data are resident on the client, and executed on the client SetUp C Base Software C Design C Render C Data S Script C Vis5D
FAST: CFD visualization system from NASA Ames Setup and script can be downloaded from server - so a guided tour is possible FAST Expedition
Distinguished from Vis5D because system ‘SetUp’ and ‘Script’ driven from server Client can take over the ‘driving’ - hence Script is Client or Server based FAST Expedition SetUp S Base Software C Design C Render C Data S C S Script


![Real-Time Volume Graphics [03] GPU-Based Volume Rendering](https://cdn2.slideserve.com/4026797/real-time-volume-graphics-03-gpu-based-volume-rendering-dt.jpg)
![Real-Time Volume Graphics [07] Global Volume Illumination](https://cdn2.slideserve.com/4312752/real-time-volume-graphics-07-global-volume-illumination-dt.jpg)
![Real-Time Volume Graphics [06] Local Volume Illumination](https://cdn2.slideserve.com/4770316/real-time-volume-graphics-06-local-volume-illumination-dt.jpg)
![Real-Time Volume Graphics [05] Transfer Functions](https://cdn2.slideserve.com/5136640/real-time-volume-graphics-05-transfer-functions-dt.jpg)


![Real-Time Volume Graphics [02] GPU Programming](https://cdn3.slideserve.com/6316608/real-time-volume-graphics-02-gpu-programming-dt.jpg)