Download
1 / 15
150 likes | 276 Views
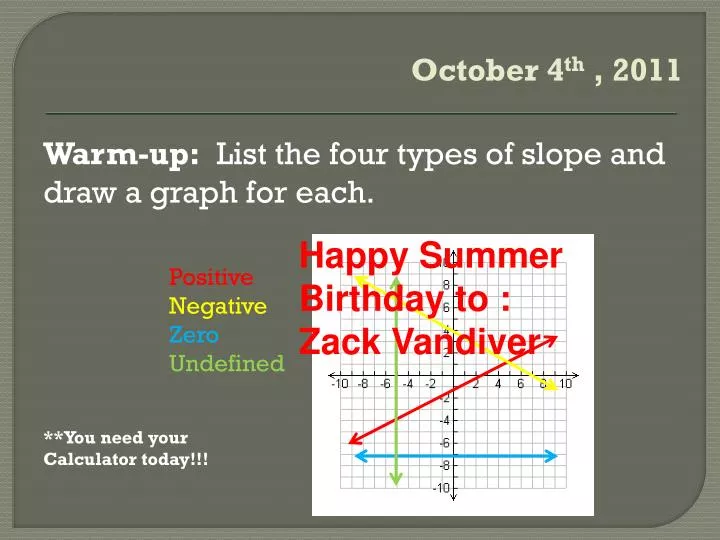
October 4 th , 2011. Happy Summer Birthday to : Zack Vandiver. Positive Negative Zero Undefined. Warm-up: List the four types of slope and draw a graph for each. **You need your Calculator today!!!. Definitions. A graph used to determine whether there is a relationship between

E N D
October 4th , 2011 Happy Summer Birthday to : Zack Vandiver Positive Negative Zero Undefined Warm-up: List the four types of slope and draw a graph for each. **You need your Calculator today!!!
Definitions A graph used to determine whether there is a relationship between paired data The relationship between two data sets A model used to represent the trend in data Scatter Plot – Correlation – Line of best fit –
Correlation positive negative no If y tends to increase as x increases, the paired data are said to have a _____________ correlation. If y tends to decrease as x increases, the paired data are said to have a _____________ correlation. If x and y have no apparent relationship, the paired data are said to have _____________ correlation.
Correlation strong weak So your options are: -strong positive correlation -strong negative correlation -weak positive correlation -weak negative correlation -no correlation If the points show a trend and are close together, it has a _____________ correlation. If the points show a trend but are not close together, it has a _____________ correlation.
Correlation strong negative no
Linear Regression y = 3x + 7 31 • Find the equation of the line that goes through the following points: (-6, -11), (-4, -5), (1, 10), (4, 19) • In your calculator: • Press STAT ENTER • Enter the x-values into L1 • Enter the y-values into L2 • Press STAT again • Arrow to the right so that CALC is highlighted • Select 4. LinReg • Press ENTER Approximate the value of y for x=8.
Linear Regression – A Little Harder y = -4.54x – 3.46 -48.86 • Find the equation of the line that goes through the following points: (-4,15), (-2, 5), (1, -7), (3, -18), (7, -35) • STAT • EDIT • L1 are x values, L2 are y values • STAT • CALC • 4. LinReg Approximate the value of y for x=10.
Estimating Age Enter the age of each of the following people in L1 of your graphing calculator, by pressing STAT EDIT
Tiger Woods Queen Latifah George W. Bush Stacy Ferguson aka. Fergie Zac Efron Julia Roberts Miley Cyrus Sarah Jessica Parker Harrison Ford Condoleezza Rice Steve Carell David Beckham
How well did you estimate? Enter the actual age of each of these personalities in L2 of your graphing calculator.
Actual Ages Tiger Woods -- 35 -- December 30, 1975 Julia Roberts -- 44 -- October 28, 1967 Condoleeza Rice -- 57 -- November 14, 1954 Queen Latifa -- 41 -- March 18, 1970 Harrison Ford -- 69 -- July 13, 1942 Stacy Ferguson -- 36 -- March 27, 1975 Miley Cyrus -- 19 -- November 23, 1992 ZacEfron -- 23 -- October 18, 1987 Steve Carell -- 49 -- August 16, 1962 Sarah Jessica Parker -- 46 -- March 25, 1965 David Beckham -- 36 -- May 2, 1975 George W. Bush -- 65 -- July 6, 1946
Guessing Ages How do you think we could judge if you are a good guesser? do a linear regression to see if the line is a good correlation
Guessing Ages Go to Window and set a reasonable window to see your data (think in years). Go to 2nd Y= and turn on Plot 1 by highlighting it and pressing ENTER twice. Enter y = x into y1 of your calculator. Where do your points fall in relationship to the perfect-guess line of y = x?
Guessing Ages The perfect-guess line of y = x is also known as the linear parent function.
Homework WS