Download
1 / 67
670 likes | 804 Views
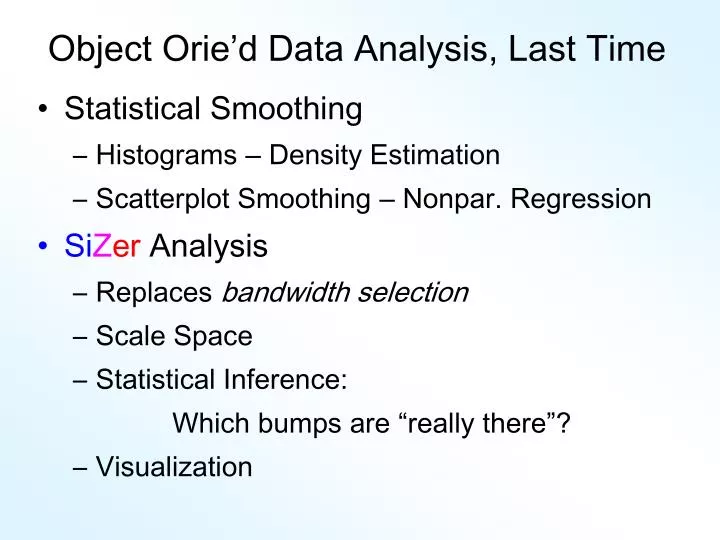
Object Orie’d Data Analysis, Last Time. Statistical Smoothing Histograms – Density Estimation Scatterplot Smoothing – Nonpar. Regression Si Z er Analysis Replaces bandwidth selection Scale Space Statistical Inference: Which bumps are “ really there ” ? Visualization.

E N D
Object Orie’d Data Analysis, Last Time • Statistical Smoothing • Histograms – Density Estimation • Scatterplot Smoothing – Nonpar. Regression • SiZer Analysis • Replaces bandwidth selection • Scale Space • Statistical Inference: Which bumps are “really there”? • Visualization
Kernel Density Estimation Choice of bandwidth (window width)? Very important to performance Fundamental Issue: Which modes are “really there”?
SiZer Background Fun Scale Spaces Views (Incomes Data) Surface View
SiZer Background SiZer analysis of British Incomes data:
SiZer Background Finance "tick data": (time, price) of single stock transactions Idea: "on line" version of SiZer for viewing and understanding trends
SiZer Background Finance "tick data": (time, price) of single stock transactions Idea: "on line" version of SiZer for viewing and understanding trends Notes: trends depend heavily on scale double points and more background color transition (flop over at top)
SiZer Background Internet traffic data analysis: SiZer analysis of time series of packet times at internet hub (UNC) Hannig, Marron, and Riedi (2001)
SiZer Background Internet traffic data analysis: SiZer analysis of time series of packet times at internet hub (UNC) across very wide range of scales needs more pixels than screen allows thus do zooming view (zoom in over time) zoom in to yellow bd’ry in next frame readjust vertical axis
SiZer Background Internet traffic data analysis (cont.) Insights from SiZer analysis: Coarse scales: amazing amount of significant structure Evidence of self-similar fractal type process? Fewer significant features at small scales But they exist, so not Poisson process Poisson approximation OK at small scale??? Smooths (top part) stable at large scales?
DependentSiZer Rondonotti, Marron, and Park (2007) SiZer compares data with white noise Inappropriate in time series Dependent SiZer compares data with an assumed model Visual Goodness of Fit test
Possible Physical Explanation IP “Port Scan” Common device of hackers Searching for “break in points” Send query to every possible (within UNC domain): IP address Port Number Replies can indicate system weaknesses Internet Traffic is hard to model
SiZer Overview Would you like to try a SiZer analysis? • Matlab software: http://www.unc.edu/depts/statistics/postscript/papers/marron/Matlab6Software/Smoothing/ • JAVA version (demo, beta): Follow the SiZer link from the Wagner Associates home page: http://www.wagner.com/www.wagner.com/SiZer/ • More details, examples and discussions: http://www.stat.unc.edu/faculty/marron/DataAnalyses/SiZer_Intro.html
PCA to find clusters Return to PCA of Mass Flux Data:
PCA to find clusters SiZer analysis of Mass Flux, PC1
PCA to find clusters SiZer analysis of Mass Flux, PC1 Conclusion: • Found 3 significant clusters! • Correspond to 3 known “cloud types” • Worth deeper investigation
Recall Yeast Cell Cycle Data • “Gene Expression”– Micro-array data • Data (after major preprocessing): Expression “level” of: • thousands of genes (d ~ 1,000s) • but only dozens of “cases” (n ~ 10s) • Interesting statistical issue: High Dimension Low Sample Size data (HDLSS)
Yeast Cell Cycle Data, FDA View Central question: Which genes are “periodic” over 2 cell cycles?
Yeast Cell Cycle Data, FDA View Periodic genes? Naïve approach: Simple PCA
Yeast Cell Cycle Data, FDA View • Central question: which genes are “periodic” over 2 cell cycles? • Naïve approach: Simple PCA • No apparent (2 cycle) periodic structure? • Eigenvalues suggest large amount of “variation” • PCA finds “directions of maximal variation” • Often, but not always, same as “interesting directions” • Here need better approach to study periodicities
Yeast Cell Cycles, Freq. 2 Proj. PCA on Freq. 2 Periodic Component Of Data
Frequency 2 Analysis • Project data onto 2-dim space of sin and cos (freq. 2) • Useful view: scatterplot • Angle (in polar coordinates) shows phase • Colors: Spellman’s cell cycle phase classification • Black was labeled “not periodic” • Within class phases approx’ly same, but notable differences • Now try to improve “phase classification”
Yeast Cell Cycle Revisit “phase classification”, approach: • Use outer 200 genes (other numbers tried, less resolution) • Study distribution of angles • Use SiZer analysis (finds significant bumps, etc., in histogram) • Carefully redrew boundaries • Check by studying k.d.e. angles
OODA in Image Analysis First Generation Problems: • Denoising • Segmentation (find object boundaries) • Registration (align objects) (all about single images)
OODA in Image Analysis Second Generation Problems: • Populations of Images • Understanding Population Variation • Discrimination (a.k.a. Classification) • Complex Data Structures (& Spaces) • HDLSS Statistics
HDLSS Data in Image Analysis Why HDLSS (High Dim, Low Sample Size)? • Complex 3-d Objects Hard to Represent • Often need d = 100’s of parameters • Complex 3-d Objects Costly to Segment • Often have n = 10’s of cases
Image Object Representation Major Approaches for Images: • Landmark Representations • Boundary Representations • Medial Representations
Landmark Representations Main Idea: • On each object find important points • Treat point locations as features • I.e. represent objects by vectors of point locations (in 2-d or 3-d) (Fits in OODA framework)
Landmark Representations Basis of Field of Statistical Shape Analysis: (important precursor of FDA & OODA) Main References: • Kendall (1981, 1984) • Bookstein (1984) • Dryden and Mardia (1998) (most readable and comprehnsive)
Landmark Representations Nice Example: • Fly Wing Data (Drosophila fruit flies) • From George Gilchrist, W. & M. U. http://gwgilc.people.wm.edu/ • Graphic Illustrating Landmarks (next page) • Same veins appear in all flies • And always have same relationship • I.e. all landmarks always identifiable
Landmark Representations Landmarks for fly wing data:
Landmark Representations Important issue for landmark approaches: Location, i. e. Registration Illustration with Fly Wing Data (next slide) Problem: • coordinates are “locations in photo” • & unclear where wing is positioned…
Landmark Representations Illustration of Registration, with Fly Wing Data
Landmark Representations Standard Approach to Registration Problem: Procrustes Analysis Idea: mod out location • Can also mod out rotation • Can also mod out size Recommended reference: Dryden and Mardia (1988)
Landmark Representations Procustes Results for Fly Wing Data
Landmark Representations Effect of Procrustes Analysis: Study Difference Between Continents • Flies from Europe & South America • Look for important differences • Project onto mean difference direction • Visualize with movie • Equal time spacing • Through range of data
Landmark Representations No Procrustes Adjustment: Movies on Difference Between Continents
Landmark Representations Effect of Procrustes Analysis: Movies on Difference Between Continents • Raw Data • Driven by location effects • Strongly feels size • Hard to understand shape
Landmark Representations Location, Rotation, Scale Procrustes: Movies on Difference Between Continents
Landmark Representations Effect of Procrustes Analysis: Movies on Difference Between Continents • Raw Data • Driven by location effects • Strongly feels size • Hard to understand shape • Full Procrustes • Mods out location, size, rotation • Allows clear focus on shape
Landmark Representations Major Drawback of Landmarks: • Need to always find each landmark • Need same relationship • I.e. Landmarks need to correspond • Often fails for medical images • E.g. How many corresponding landmarks on a set of kidneys, livers or brains???
Landmark Representations Landmarks for brains??? (thanks to Liz Bullit) Very hard to identify
Landmark Representations Look across people: Some structure in common But “folds” are different Consistent Landmarks???