Download
1 / 20
200 likes | 214 Views
Frequency domain analysis and Fourier Transform Based on slides from S. Narasimhan CMU. How to Represent Signals?. Option 1: Taylor series represents any function using polynomials. Polynomials are not the best - unstable and not very physically meaningful.

E N D
Frequency domain analysis and Fourier Transform Based on slides from S. Narasimhan CMU
How to Represent Signals? • Option 1: Taylor series represents any function using polynomials. • Polynomials are not the best - unstable and not very physically meaningful. • Easier to talk about “signals” in terms of its “frequencies” (how fast/often signals change, etc).
Jean Baptiste Joseph Fourier (1768-1830) • Had crazy idea (1807): • Any periodic function can be rewritten as a weighted sum of Sines and Cosines of different frequencies. • Don’t believe it? • Neither did Lagrange, Laplace, Poisson and other big wigs • Not translated into English until 1878! • But it’s true! • called Fourier Series • Possibly the greatest tool used in Engineering
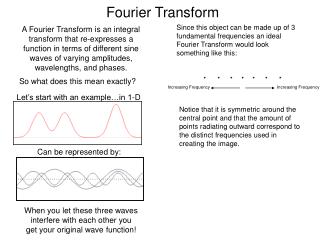
A Sum of Sinusoids • Our building block: • Add enough of them to get any signal f(x) you want!
Inverse Fourier Transform Fourier Transform F(w) f(x) F(w) f(x) Fourier Transform • We want to understand the frequency w of our signal. So, let’s reparametrize the signal by w instead of x: • For every w from 0 to inf, F(w) holds the amplitude A and phase f of the corresponding sine • How can F hold both? Complex number trick!
Time and Frequency • example : g(t) = sin(2pi f t) + (1/3)sin(2pi (3f) t)
Time and Frequency • example : g(t) = sin(2pi f t) + (1/3)sin(2pi (3f) t) = +
Frequency Spectra • example : g(t) = sin(2pi f t) + (1/3)sin(2pi (3f) t) = +
FT: Just a change of basis M * f(x) = F(w) = * . . .
IFT: Just a change of basis M-1 * F(w)= f(x) = * . . .
Arbitrary function Single Analytic Expression Spatial Domain (x) Frequency Domain (u) Fourier Transform – more formally Represent the signal as an infinite weighted sum of an infinite number of sinusoids Note: (Frequency Spectrum F(u)) Inverse Fourier Transform (IFT)
Fourier Transform • Also, defined as: Note: • Inverse Fourier Transform (IFT)
Let us use a Gaussian kernel • Then Example use: Smoothing/Blurring • We want a smoothed function of f(x) H(u) attenuates high frequencies in F(u) (Low-pass Filter)!
Image Processing in the Fourier Domain Magnitude of the FT Does not look anything like what we have seen
Convolution is Multiplication in Fourier Domain |F(sx,sy)| f(x,y) * h(x,y) |H(sx,sy)| g(x,y) |G(sx,sy)|
Low-pass Filtering Let the low frequencies pass and eliminating the high frequencies. Generates image with overall shading, but not much detail
High-pass Filtering Lets through the high frequencies (the detail), but eliminates the low frequencies (the overall shape). It acts like an edge enhancer.