Download
1 / 24
240 likes | 409 Views
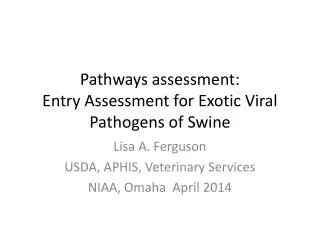
HydroQual Capabilities for Pathways Analysis in Support of Natural Resource Damage Assessment. Why Consider Models for Pathways Analysis?. Models link the sources with observed body burdens in organisms Models can add value to data by extending spatial and temporal coverage

E N D
HydroQual Capabilities for Pathways Analysis in Support of Natural Resource Damage Assessment
Why Consider Models for Pathways Analysis? • Models link the sources with observed body burdens in organisms • Models can add value to data by extending spatial and temporal coverage • Models have predictive capabilities - what will the future of the resource be after remedial action?
Noted HydroQual Model Component Experts • Hydrodynamic Transport – Nicholas Kim • Organic Carbon Production – James Fitzpatrick • Chemical Fate and Transport – Robin Landeck Miller • Biotic Ligand Model – Robert Santore • Food Chain/Bioaccumulation – Kevin Farley • Toxicity Prediction – Joy McGrath
Hydrodynamic Transport • Rivers, lakes, streams, estuaries, coastal ocean, embayments in 1-D, 2-D, or 3-D • Landside loadings and atmospheric exchanges and fluxes • Several model codes (ECOM, EFDC, RRMP, SWMM) • Accounts for physical movement of the water and dissolved and particulate substances
Sediment Transport • Directly linked to hydrodynamic model results • Can be used to support contaminant fate and transport with “foc” approach • Addresses both cohesive and non-cohesive sediment types • ECOMSED and GLERL codes • Provides vertical phase transport terms for particulate contaminants (settling, burial, resuspension)
Organic Carbon Production • Directly linked to hydrodynamic model results • May also be linked to sediment transport model results • A refinement over “foc” approaches (particularly for low molecular weight PCB homologs) • RCA code • Provides direct calculation of the phase to which hydrophobic organic contaminants partition with independent checks
Contaminant Fate and Transport • Directly linked to hydrodynamic transport and organic carbon production model results • Multiple pollutant types (HOC’s, metals, methyl mercury) • Can be modified to support relevant processes (volatilization, photolysis, dechlorination, phase partitioning) • WASTOX, GISTOX, RCATOX codes • Provides for the movement and transformation of dissolved and particulate phases of contaminants
Selected Toxic/Chemical Fate Modeling Housatonic River & NY/NJ Harbor recently completed
The Biotic Ligand Model (BLM) • Uses standard chemical parameters as inputs (pH, DOC, alkalinity, cations, anions) • Can predict metal toxicity to aquatic organisms • BLM predictions can be used to assess potential risk due to environmental metal concentrations • Can be used to look at spatial, temporal trends in a water body or region
H+ Ca+2 Na+ Gill Surface (biotic ligand) Competing Cations Organic Ligand Complexes Free Free Metal Binding Site M - DOC Metal ion Metal ion M+2 M+2 Inorganic Ligand Complexes M OH+ M CO3+ M Cl+ Generalized BLM Framework
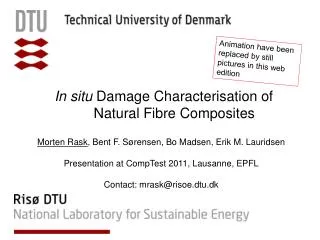
) t 40 p p ( 30 y t i n 20 i l a S 10 0 10 ) L / g 8 m ( 6 C 4 O D 2 0 10 9 8 H p 7 6 5 4 10 PREDICTED AVERAGE AND RANGE 8 R 6 E W 4 2 BAY-WIDE 0 WER = 1.7 -10 0 10 20 30 40 50 Distance from Golden Gate Bridge (miles) (Data: S.San Francisco Bay RMP, 1993 - 1996) San Francisco Bay Case Study
BLM Application Status • Applied to Cu, Ag, Zn • Cd, Ni, Pb under development • No Al or Cr • Acute toxicity, aqueous exposures • Mostly freshwater
Where BLM is Heading • Chronic Exposures • Multiple routes of exposure (i.e., particulate metals) • Multiple metals • Include sediment pore water effects in addition to SEM:AVS
Toxicity Prediction • Answer the question, “What level of a contaminant causes an effect?” • Difficult because bioavailability varies over a wide range of contaminant concentrations • Approaches developed: Equilibrium partitioning SEM:AVS Narcosis theory/target lipid model • Has led to sediment quality criteria
Equilibrium Partitioning (EqP) • Sediment concentrations normalized to correct for varying bioavailability. • Published by EPA ORD as “Sediment Quality Benchmarks” (2000) • - Nonionic Organics (EPA-822-R-00-001, -002) • - Dieldrin, Endrin (EPA-822-R-00-003, -004) • - Cd, Cu, Ni, Pb, Zn and Ag as mixtures • (EPA-822-R-00-005) • - Total PAHs as mixtures
PAH Criteria • Narcotics • Based on Universal Narcosis Slope • Toxicity is Additive • Lipid Based Body Burden
Predicted Toxicity for Single PAHs and PAH Mixtures in Sediments
Contact Information Further information on HydroQual’s Natural Resource Damage Assessment services may be obtained from: Robin Landeck Miller HydroQual, Inc. 1200 MacArthur Boulevard Mahwah, New Jersey 07430 201-529-5151 ext. 7119 rmiller@hydroqual.com