Download
1 / 28
280 likes | 474 Views
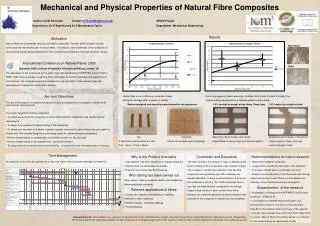
Animation have been replaced by still pictures in this web edition. In situ Damage Characterisation of Natural Fibre Composites. Morten Rask , Bent F. Sørensen, Bo Madsen, Erik M. Lauridsen Presentation at CompTest 2011, Lausanne, EPFL Contact : mrask@risoe.dtu.dk. Motivation.

E N D
Animation have beenreplaced by still pictures in this web edition In situ Damage Characterisation of Natural Fibre Composites • Morten Rask, Bent F. Sørensen, Bo Madsen, Erik M. Lauridsen • Presentation at CompTest 2011, Lausanne, EPFL • Contact: mrask@risoe.dtu.dk
Motivation • Can the plantswegrow in fieldsbeused for structuralcomponents? • Can plant fibers beoptimized to performsimilar to fossil based fibers? • A part of thisoptimization is to understand the damagemechanics tinyurl.com/ox42gc tinyurl.com/lukvqq tinyurl.com/lp34pc Flax Hemp
Outline • Natural Fibre Composites • X-ray tomography • Results • Conclusion
Outline • Natural Fibre Composites • X-ray tomography • Results • Conclusion
A piece of hemp yarn • Short fibres → twisting • Fibres can form bundles tinyurl.com/muxhkq tinyurl.com/n675jn • Yarn is spun from a large number of fibres • Lenght of fibres • 50mm • Diameter of yarn • 200-500µm • Diameter of fiber • 5-15µm B Madsen et. al. Comp Part A. 2007.
Composite fabrication Picture courtesy of Bo Madsen tinyurl.com/n4yxka Commingled filament winding • Hemp/flax fibers and polymermatrix systems • Unidirectional laminates • Uniform distribution of fibres and matrix • Well-controlled fiber volume fraction Press consolidation • Small amount of porosities • Short consolidation time
Porosities in natural fibre composites • Complicatedsurfacechemistry • Irregular form and dimension along fibres • Fibres arecloselypacked by twisting B Madsen et. al. Comp Part A. 2007.
3D volume of yarn – close up Yarn of twisted fibres Non-regularsurface → Impregnation is difficult Kink band defect Fibres arehollow 20µm
Do porosities influence damage? • Unidirectionalcompositescan display splitting along fibres. • Howcanthisbeenergeticallyfavourable? • Weak planes caused by porosities?
Damage characterisation With these methods it is not possible to characterise damage completely → Tomography Limitations: • Limited to surface, destructive • No information on type of damage • Limited resolution, crack directionsensitive • Polishingartifacts, destructive Traditional Methods: Microscopy post-failure inspection Acoustic emission Ultrasound scanning Serialsectioning
Outline • Natural Fibre Composites • X-ray tomography • Results • Conclusion
X-ray Tomography Example: CT-scanning Jaw Jaw • A synchrotron X-ray beam is used to scan the material of choice. • A computer algorithmconverts the large number of 2D projections to 2D slices. • From these slices, the 3D structure can be reconstructed. • Advantages: • 3D imaging • High resolution (~ 1µm) • Non-destructive tinyurl.com/lekvys
Test specimens and fixture 5mm Onlynotcharea is scanned Small notchedcompositespecimenswerescanned Different yarn samples were scanned Scanning was done at different load levels in specialloadingfixture
Outline • Natural Fibre Composites • X-ray tomography • Results • Conclusion
3D animation • Fibres are light grey • Matrix is transparent • Cracks are red • Animation shows red boxbelow • Dimensions of box is 1.4 x 1.4 x 1.4 mm3
Evolution of interface cracks • Cracks areoftenseen at fibre bundles Fibre bundles Plane of view 100µm
Two fibre breaks • Shear cracks • Cracksfollow fibre/matrix interfaces Shearcracking Plane of view Fibre breaks 33µm Field of view
Evolution of shear cracks Shearcracking Plane of view 25µm Field of view
Shear cracks • Path is dictated by fibre/matrix interfaces Plane of view Interface driven shear crack I 125µm Field of view
Long splitting crack emanating from notch stress concentration • Path follows fibre/matrix interfaces • Eight fibre breaks are visible, someweak bands areseen. Plane of view Fibre breaks at kink bands Splitting crack along interfaces 125µm Field of view
Largebreak-away • Path dictated by fibre/matrix interfaces Plane of view Crack along interfaces 125µm Field of view
Fibre breaks at weak bands in fibres • Breaks at threeneighbouring fibres. Noweak band seen in middle fibre – failure by stress transfer? Plane of view Fibre breaks at kink bands 33µm Field of view
Shear cracks symmetric in position and direction? Plane of view Shear cracks 125µm Field of view
X-ray data FEM simulation of s12
Outline • Natural Fibre Composites • X-ray tomography • Results • Conclusions
Conclusions • Damagemechanisms • Splitting cracks driven by interfaces • Shear cracks • Fibre breaks • How to takethese observations to the nextlevel? • FEM simulation? • Displacement image correlations? • …
Acknowledgment • The research leading to these results has received funding from the European Comunity’s Seventh Framework Programme (FP7/2007‐2013) under grant agreement no 214467 (NATEX) • Tomcatbeamline at Swiss Light source • Professor Ian Sinclair,University of Southhampton, for providingloadingfixture