Download
1 / 22
220 likes | 320 Views
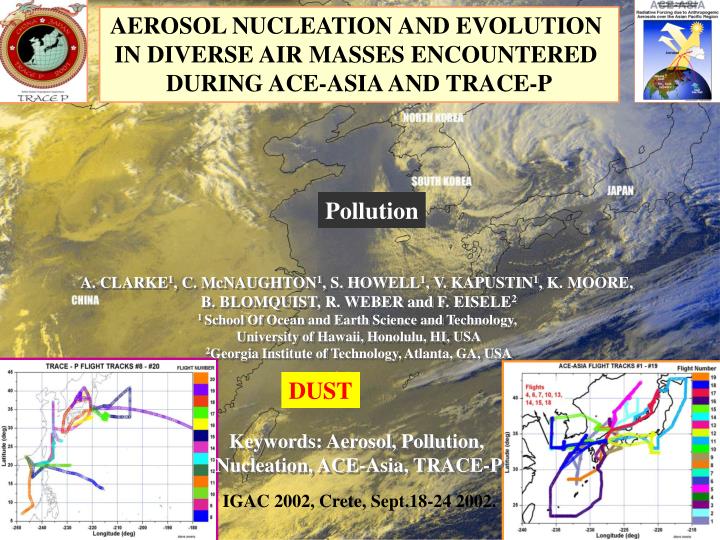
AEROSOL NUCLEATION AND EVOLUTION IN DIVERSE AIR MASSES ENCOUNTERED DURING ACE-ASIA AND TRACE-P. A. CLARKE 1 , C. McNAUGHTON 1 , S. HOWELL 1 , V. KAPUSTIN 1 , K. MOORE, B. BLOMQUIST, R. WEBER and F. EISELE 2 1 School Of Ocean and Earth Science and Technology,

E N D
AEROSOL NUCLEATION AND EVOLUTION IN DIVERSE AIR MASSES ENCOUNTERED DURING ACE-ASIA AND TRACE-P A. CLARKE1, C. McNAUGHTON1, S. HOWELL1, V. KAPUSTIN1, K. MOORE, B. BLOMQUIST, R. WEBER and F. EISELE2 1 School Of Ocean and Earth Science and Technology, University of Hawaii, Honolulu, HI, USA 2Georgia Institute of Technology, Atlanta, GA, USA Keywords: Aerosol, Pollution, Nucleation, ACE-Asia, TRACE-P Pollution DUST IGAC 2002, Crete, Sept.18-24 2002.
FIRST What do we know about Nucleation and naturally formed CN and CCN on global scales.
Ccrit = 0.16*exp(0.1*T – 3.5*RH – 27.7) (Kerminen & Wexler, 1994) Clarke, A.D., V. Kapustin, Jour. Atmos. Sci., v59, 3, Part 1, 2002.
Data from 4 major Pacific Experiments GLOBE Highest Number Concentrations Aloft over Tropics and across entire Pacific Regions influenced by Strong Convection (top of Hadley cell) Clarke, A.D., V. Kapustin, Jour. Atmos. Sci., v59, 3, Part 1, 2002. And in Atmospheric Cemistry in a Changing World, IGAC
Averaged Size Distributions for 6 Profiles in Subsidence Region Between ITCZ & SPCZ INVERSION Above is example of cycle suggested by ACE-1 work Clarke, A.D., et al., Jour. Geophys, Res., 103, 16,397-16,409, 1998
THIS LARGE-SCALE PROCESS OF FORMATION ALOFT SUBSIDENCE AND GROWTH APPEARS TO BE A MAJOR GLOBAL SOURCE OF NATURAL NEAR-SURFACE CCN WHAT ABOUT RELATIVE GLOBAL IMPORTANCE OF NUCLEATION FOR HIGH SOURCE-STRENGTH POLLUTED REGIONS?
TRACE Events with Weber, 3-8 nm particle concentrations greater than 100 particles/cm3 ACE-Asia Nucleation Events with UH DMA peaks less than 40 nm
Partial Neutralization? Soot TRACE 14 (April 2, 2001) Three AREA distributions & Continuous NUMBER distribution N>S S>N TURN
TRACE 14 (April 2, 2001) Continuous Measurements of CN, H2SO4 etc. through Plume
Trajectories from NOAA’s HYSPLIT show that airmass measured South of Kyushu on Flight 8 was sampled on flight 7 the previous day (+/- 30km)
Ccrit = 0.16*exp(0.1*T – 3.5*RH – 27.7) (Kerminen & Wexler, 1994) Inversion Ccrit,,expected concentration of [H2SO4] for binary nucleation, is lowest in region of low temp - high RH. Drop in surface area across inversion coincident with high CN in spite of well mixed boundary layer indicates this a favored nucleation region for binary or ternary (NH4) nucleation. • Questions - For nucleation modes formed in strong pollution: • What is the fate of these particles as they move out over the Pacific? • Does atmospheric lifetime allow them to grow to CCN?
Daytime diameter increase for Unheated Nuclei (sulfuric+sulfate)Mode V = /6 D3 dV/dt = /2 D2 dD/dt = A dD/dt dD/dt = [dV/dt] / A = Flux per unit area to nuclei size mode Use this flux and total aerosol surface area to estimate total condensing flux Daytime diameter increase for 150C Nuclei (ammonium bi-sulfate)Mode
Estimated Sulfuric Acid Flux to Total Size distributions Assumes accommodation coefficient = 1 for all sizes Production Rates of H2SO4 for TRACE-P Flight #14 in the Yellow Sea were 0.5 – 2.0*106 molecules/cm3/sec. (Weber & Eisele, draft TRACE-P)
COMPARISIONS OF NO-CLOUD COAGULATION (top) vs. CONDENSATION (bottom) IN SHAPING SIZE EVOLUTION FOR FLT 8 USING DERIVED H2SO4 PRODUCTION RATE [1.2x10^6 #/cm3/s] Secondary Primary After 3hr
CONCLUSIONS for Nucleation in Asian Plumes • Strong Nucleation in high surface area pollution/dust plumes on scales 100-1000km • Early Morning Nucleation common with growth about 1-2um/hr • Additional regions with localized ongoing nucleation - inversions & high RH • High S02 and Sulfuric Acid with Ammonia suggests ternary process • Flux of sulfuric acid to aerosol is similar to source strength – about 0.5-2 x10^6 cm3/s HOWEVER – Strong secondary nucleation events are not always evident for this high source strength region. Even if present, after aging 24hr (or processing in cloud cycles), these secondary nuclei in pollution are often a small fraction of the larger primary nuclei that originally formed on soot. Suggesting small relative contributors to global CCN and light scattering aerosol. HYPOTHESIS – On global scales nucleation in pollution plumes is small contributor. Global CCN (Dp>80nm) probably dominated by secondary aerosol evolved from natural processes in the free troposphere and contributions of primary soot nuclei (internally mixed) from high temperature combustion (biomass and pollution).
Why do we care?Scientific /Practical Questions Evolution of particle number provides source of new CCN. What are pathways to modifying regional global CCN, cloud radiative properties, hydrologic cycle? Required to properly assess global life cycle of atmospheric aerosol Evaluation of natural vs. anthropogenic contributions? Understand sinks and transformations of gas phase species. Potential effects of gas vs. particle emission control strategies?
Similarities & Differences in Soot Distributions for Combustion from Urban and Biomass
Comparison of ACE C-130 DMA data (UH) and Surface Date (Brookhaven) at Kosan
Evidence for morning nucleation and growth V = /6 D3 dV/dt = /2 D2 dD/dt = A dD/dt dD/dt = [dV/dt] / A = Flux per unit area to that size mode