Download
1 / 60
600 likes | 738 Views
A Preview of Recent Land Cover Mapping for Connecticut. James D. Hurd Jason Parent, Anna Chabaeva and Daniel Civco C enter for L and use E ducation A nd R esearch (CLEAR) Department of Natural Resources Management & Engineering The University of Connecticut

E N D
A Preview of Recent Land Cover Mapping for Connecticut James D. Hurd Jason Parent, Anna Chabaeva and Daniel Civco Center for Land use Education And Research (CLEAR) Department of Natural Resources Management & Engineering The University of Connecticut U-4087, Room 308, 1376 Storrs Road Storrs, CT 06269-4087
The Center for Landuse Education And Research (CLEAR) Established April, 2002 clear.uconn.edu
The Center for Landuse Education And Research (CLEAR) clear.uconn.edu Established April, 2002 CLEAR conducts remote sensing research, develops analysis tools and training programs, delivers outreach educational programs.
The Center for Landuse Education And Research (CLEAR) clear.uconn.edu To provide information, education and assistance to land use decision makers, in support of balancing growth and natural resource protection. NEMO GTP National NEMO Network LERIS Forestry GVI
Connecticut’s Changing Landscape What is Connecticut’s Changing Landscape (CCL)? - An ongoing project that tracks land cover changes in Connecticut’s landscape over time. - Uses Landsat Satellite imagery to derive a consistent set of land cover maps. - Currently nearing completion of a 2006 update. - With the update, will consist of 5 dates of land cover (1985, 1990, 1995, 2002, 2006) consisting of 12 land cover categories. - Also includes products derived from land cover: forest fragmentation, urban growth, impervious surfaces.
Connecticut’s Changing Landscape clear.uconn.edu clear.uconn.edu/ccl.htm Land Cover and Land Cover Change UrbanGrowth Forest Fragmentation Impervious Surfaces
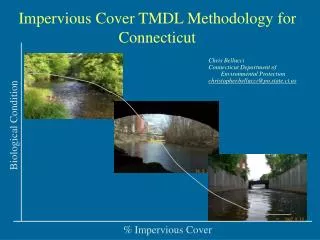
Why Land Cover? - Land Cover is the basis for understanding our landscape. What is where? - Multiple dates of land cover are necessary to understand the nature of landscape change. What did it change to? - Many landscape models require land cover information.
Image to Map Landsat Satellite Image Land Cover Map 33% developed 46% forest 5% water This is a picture You can measure & analyze this
Image Comparison Both images collected late summer 2006 Landsat 100 foot spatial resolution NAIP 3 foot spatial resolution
Connecticut’s Changing Landscape 1985 1990 VERSION 2.x CCL 1995 2002
Connecticut’s Changing Landscape VERSION 2.x CCL 2006 Land Cover
Connecticut’s Changing Landscape 1985 Land Cover
Connecticut’s Changing Landscape 1990 Land Cover
Connecticut’s Changing Landscape 1995 Land Cover
Connecticut’s Changing Landscape 2002 Land Cover
Connecticut’s Changing Landscape 2006 Land Cover
Increase In Development 1985 to 2006 No Change Change to Developed
Change In Agriculture 1985 to 2006 No Change Change in Agriculture
Agriculture and Forest Loss 1985 to 2006 No Change Classes Change Classes
Connecticut’s Changing Landscape PRELIMINARY
Connecticut’s Changing LandscapeTracking Change R2 = - 0.9821 R2 = 0.9722 R2 = - 0.8956 FOREST = deciduous, coniferous, forested wetland DEVELOPED = developed, turf & grass AGRICULTURE = agriculture
New Method: Morphological Image Processing = SE2 = SE1 erosion operator, dilation operator (expand forest) (shrink forest) Forest Fragmentation Old Method: Image Convolution = calculate Pf and Pff
Forest Fragmentation Analysis applied to the center forest pixel Core Forest – All pixels in SE1 are forest. Patch Forest – Forest pixels that are isolated from core forest pixels (uses SE2 with repeated dilations). Edge Forest – forest pixels on the edge of large non-forested features (uses SE1 on non-forest pixels with repeated dilations). Perforated Forest – forest pixels surrounding smallnon-forested features (remaining unlabeled forest pixels).
Urban Growth MetricsDerivation Manifestation metrics based on the “urbanness” of the neighboring area • Urbanness = % of pixels in neighborhood that are built-up • The neighborhood is a 1 km2 circle centered on each pixel 252 pixels = 0.2 km2 Urbanness = 0.2 / 1 = 20%
Urban Growth MetricsDefinitions Built-up (developed pixels) 30 to 50% urban < 30% urban > 50% urban Linear semi-contiguous groups approx. 100 meters wide Largest contiguous group of pixels All other groups All other groups Secondary core Main core Fringe Ribbon Scatter
Urban Growth MetricsDefinitions Landsat image Built-up area (impervious surfaces) Open space (OS) (non-developed pixels) Urbanized OS (> 50 % built-up) Peripheral OS (< 100 m from built-up) Urbanized area Urban footprint
Urban Growth Analysis 1985 Urban Landscape
Urban Growth Analysis URBAN FOOTPRINT = all built-up pixels (urban core, urban fringe, urban scatter) andurbanized open space pixels (urbanized open space, interior urbanized open space, peripheral open space).
Urban Growth Analysis • Development occurring between time periods T1 and T2 • Classification based on location relative to the T1 urban area • Infill: new development occurring within the T1 urbanized open space • Extension: new non-infill development intersecting the T1 urban footprint • Leapfrog: new development not intersecting the T1 urban footprint
Urban Growth Analysis 1985 to 2006
Urban Growth Analysis • Infill -development of a small area surrounded by existing developed land. • Expansion - the spread of development from existing developed areas. • Outlying - characterized by a change from undeveloped to developed beyond existing developed areas. • Isolated –small developed area surrounded by undeveloped land. • Linear Branching –linear development • Clustered Branching –large cluster of developed pixels.