Download
1 / 26
260 likes | 374 Views
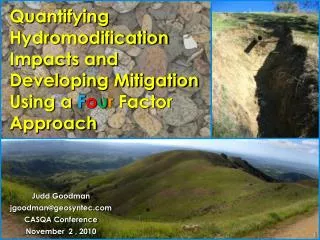
Quantifying Hydromodification Impacts and Developing Mitigation Using a F o u r Factor Approach. Judd Goodman jgoodman@geosyntec.com CASQA Conference November 2 , 2010. Objectives. What is geomorphology ?. Why should I care about it ?. How are geomorphic impacts modeled ?. ). f (.

E N D
Quantifying Hydromodification Impacts and Developing Mitigation Using a FourFactor Approach Judd Goodman jgoodman@geosyntec.com CASQA Conference November 2 , 2010
Objectives What is geomorphology? Why should I care about it? How are geomorphic impacts modeled? ) f( Δhydrology, Δchannel geometry, Δbed & bank material strength, Δsediment supply = Geomorphic Impact
What is geomorphology? Geomorphology = the scientific study of landforms and the processes that shape them Fluvial = of, relating to, or occurring in a river or stream GeomorphicImpact = Changes in landforms and the processes that shape them. Often caused by land use change. Restoration vs. Hydromod Management prevent a future geomorphic impact fix an existing geomorphic impact
Why care about geomorphology? Example of geomorphic impact: Judd flow flow flow flow 17-ft 140-ft ~290 acre watershed Hydromod! 300-ft Post-Development Pre-Development 4 Images from GoogleEarth Include watershed changes and outfall undermining
How are geomorphic impacts modeled? Qualitative: QsD50αQwS Lane (1955) ) f( Δhydrology, Δchannel geometry, Δbed & bank material strength, Δsediment supply Quantitative: Geomorphic Impact = Source: Rosgen (1996), From Lane, 1955. Reprinted with permissions
Δhydrology Hydrologic Models are applied to simulate the hydrologic response of catchments under pre- and post-developed conditions for a continuous period of record. flow • Hydrologic Inputs: • Rainfall • Catchment Delineation • Soils • % Imperviousness • Lag Time • In-stream Infiltration • Evapotranspiration Post-Urban Discharge Pre-Urban Time
Δhydrology Flow output from hydrologic model is used to generate flow duration curves. Currently Hydromodification Management focuses on State of the practice is flow-duration matching. Δhydrology
Δchannel geometry Cross-sections and longitudinal profiles of the active channel are surveyed at strategic locations during the geomorphic field assessment. flow Plan View
Δbed & bank material strength For each cross-section surveyed, a measure of critical shear stress is obtained on the bed and bank material. • Non-cohesive bed: • Wolman Pebble Count • and/or Sieve Analysis • Cohesive bed and bank: • Jet Test • or Characterize using Tables • Vegetated bank: • Characterize using Tables
Δsediment supply Sediment yields are calculated using a GIS raster based analysis. Sediment generated from developed land and areas tributary to detention facilities are removed in the post-project condition. % Sed Reduction = [ Yield (pre) - Yield (post) ] Yield (pre) Sediment Yield Map
Model Summary Rainfall, Catchment Delineation, Soils, % Imperviousness, Lag Time, In-stream Infiltration, Evapotranspiration Hydrologic Model Flow Duration Curve Hydraulic Model Channel Geometry Stage, Shear stress, Velocity Transport Model Bed & Bank Material Strength Ratio of Transport Work/ Transport Statistical Model Sediment Supply Reduction Ratio of Sed Supply Probability of Geomorphic Impact
Estimating Geomorphic Impact Step 1: Stage, effective shear stress, and flow velocity are computed using flow duration and channel geometry data as inputs to a hydraulic model. Work for Consolidated Material: Step 2: Stage, effective shear stress, flow velocity, and critical bed / bank material strengthare then input into the applicable work or sediment transport equation and summed over the period of record.
Estimating Geomorphic Impact Step 3: Ratio of Transport is calculated by comparing relative changes in total work/transport capacity in the pre- and post-development conditions: Transport post Transport pre
Estimating Geomorphic Impact Step 4: Sediment supply loss is accounted for by reducing the baseline Ratio of Transport by the Ratio of Sediment Supply to that computation point. Sediment Supply post Target Ratio of Transport = Sediment Supply pre Step 5: For each cross-section location the Ratio of Transport is compared to the Ratio of Sediment Supply (Target Ratio) to get a Probability of Instability. Study in Bay Area: Ratio of Transport (Target = 1.0)
Statistical Relationship Santa Clara Valley HMP Ratio of Transport • 40 Cross Sections: • Thompson Creek • Ross Creek • San Tomas Creek
Out-of-Stream Mitigation Rainfall, Catchment Delineation, Soils, % Imperviousness, Lag Time, In-stream Infiltration, Evapotranspiration Hydrologic Model Flow Duration Curve Hydraulic Model Channel Geometry Stage, Shear stress, Velocity Transport Model Bed & Bank Material Strength Ratio of Transport Work/ Transport Statistical Model Sediment Supply Reduction Ratio of Sed Supply Probability of Geomorphic Impact
Out-of-Stream Mitigation Route post-development runoff through flow duration control facilities to mimic pre-development hydrology. Detention Basin Bio-Retention
In-Stream Mitigation Rainfall, Catchment Delineation, Soils, % Imperviousness, Lag Time, In-stream Infiltration, Evapotranspiration Hydrologic Model Flow Duration Curve Hydraulic Model Channel Geometry Stage, Shear stress, Velocity Transport Model Bed & Bank Material Strength Ratio of Transport Work/ Transport Statistical Model Ratio of Sed Supply Sediment Supply Reduction Probability of Geomorphic Impact
In-Stream Mitigation Reduce longitudinal slope with in-stream grade control structures to mimic pre-development work/sediment transport. Goal: Conserve Transport
Project Solution? • Equilibrium Slope = 0.2% may not be feasible to construct. • Outfall structure needs to be retrofit to properly dissipate energy. • Opportunity for combined flow control and grade control mitigation.
Rainfall, Catchment Delineation, Soils, % Imperviousness, Lag Time, In-stream Infiltration, Evapotranspiration Hydrologic Model Thank You! Questions? Flow Duration Curve Hydraulic Model Channel Geometry Stage, Shear stress, Velocity Transport Model Bed & Bank Material Strength Ratio of Transport Work/ Transport Statistical Model Ratio of Sed Supply Sediment Supply Reduction Probability of Geomorphic Impact f( ) Δhydrology, Δchannel geometry, Δbed & bank material strength, Δsediment supply = Geomorphic Impact