Download
1 / 26
260 likes | 270 Views
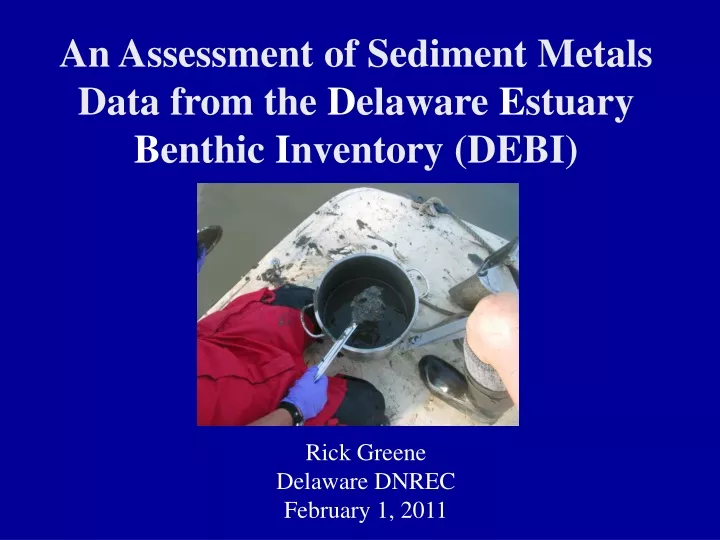
An Assessment of Sediment Metals Data from the D elaware E stuary B enthic I nventory (DEBI). Rick Greene Delaware DNREC February 1, 2011. Presentation Outline. Background on DEBI Questions addressed using the metals data Data assessment methods Findings Recommendations.

E N D
An Assessment of Sediment Metals Data from the Delaware Estuary Benthic Inventory (DEBI) Rick Greene Delaware DNRECFebruary 1, 2011
Presentation Outline • Background on DEBI • Questions addressed using the metals data • Data assessment methods • Findings • Recommendations
Delaware Estuary Benthic Inventory • Circa. 2005, scientists and resource managers identified need to better characterize & understand the benthic environment of the Delaware Estuary. • Benthic: “of, relating to, or occurring at the bottom of a body of water .” (i.e., aquatic sediments and their physical, chemical, & biological attributes). • To meet the need, a major field survey was undertaken in 2008 - one component involved collection & analysis of metals & PCBs in sediments. No tox tests. • Delaware requested the draft data from PDE to better inform a pressing management decision (main channel deepening).
DEBI Sampling & Analysis • Field Work: • Led by PDE & EPA 3, with assistance from many others • Sampling from EPA’s R/V Lear 7/9/2008 – 9/12/2008 • 227 sub-tidal estuarine stations, South Philadelphia to Capes based on a random stratified design • Ponar grabs collected surface sediment • Laboratory: • Conducted by EPA 3 Fort Meade, MD lab • 15 metals plus grain size • Methods: 200.7 (ICP-AES); 200.8 (ICP-MS); and 245.5 (CV-AA). Total, hot acid digestion not performed. Results reflect labile, readily extractable metal, not total.
DEBI Sediment Sampling Sites DRBC Zones Zone 3 to upper 5 urban/industrial Main Navigation Channel Zone 6 agriculture/ rural/marsh
Questions • Do metals in the sediments of the Delaware Estuary pose a significant risk to benthic aquatic life? This is a baseline, pre-dredging question. • Does deepening/dredging the main navigation channel mobilize metals to the water column & create acutely toxic, potential lethal conditions in the turbidity plume near the dredge? • What is the fate of metals excavated during channel deepening & does the release near the dredge + return flows from the CDF cause broader scale violations of chronic aquatic life criteria & human health criteria?
Data Assessment: In-place Sediments • Plot the data, look for spatial patterns & correlations. • Use equilibrium partitioning (EqP) to predict dissolved metal concentrations in sediment pore water (dissolved metal is better measure of bioavailability & therefore toxicity). • Calculate toxic units (TUs) as ratio of predicted dissolved metal conc. to dissolved aquatic life criterion. When ∑ T.U.s > 1 for divalent metals, there’s potential toxicity to benthic aquatic life. • DID NOT compare sediment conc. to SQGs (e.g., ERLs, ERMs, AETs, TELs, PELs, etc). Also, DID NOT compare to other datasets (e.g., NOAA, EMAP, USGS) since analytical method were different.
Copper in Sediment & Surface Water • Concentration highest in upper zone 5 • Higher towards shore • Significant relationship with silt clay fraction (p<0.01) but weak (r = 0.46) • Cu in sediment follows overall pattern in water column
Mercury in Sediment & Surface Water • Concentration highest in upper zone 5. • Higher towards shore. • Significant relationship with silt clay fraction (p<0.01) but weak (r = 0.29). • Hg in sediment follows overall pattern in water column.
Zinc in DEBI Sediment & Christina Core • Concentration highest in upper zone 5. • Higher towards shore. • Significant relationship with silt clay fraction (p<0.01) but weak (r = 0.29). • Historic loading from Christina
Predicted Acute Toxic Units in Pore Water • Acute toxic units marginally > 1 at 2 of 227 sites (<1%) • Both on Cherry Island Flats & both dominated by silt-clay • Predicted mean & median TUa by zone not acutely toxic
Is Equilibrium Partitioning Reliable? • Sediment toxicity not measured as part of DEBI. Hence, no “ground truth”. • However, matching sed tox & metals data are available for 1997 NOAA dataset. • EqP was applied to those data & predictions compared to observations.
Predicted Chronic Toxic Units in Pore Water • Chronic toxic units > 1 at 46 of 227 sites (~20%). All in zones 4 & 5, except 1 site in upper zone 6. • Unexpected: Cd is risk driver (~80% of TUa) based on stringency of freshwater chronic criterion. • Review of the Cd criterion reveals it is very conservative & may overstate risk for the Delaware Estuary (Greene, 2010b) • Also, limited SEM – AVS data from EMAP suggests Cd bound in sulfide & non-available (Di Toro et al 2005) • Weight of Evidence: chronic tox to benthic aquatic life due to divalent metals possible, but not likely. Sharper tools available.
Predicted Metals Conc. Behind Dredge • Federal Judge authorized deepening of navigation channel between Del Mem Br & Reedy Island (“Reach C”) in 2010. • DNREC predicted the increase in near-field metal concentrations 200’ behind cutterhead (edge of mixing zone) based on plume behavior, DEBI data & EqP • Results compared to acute criteria.
Results for Dissolved Metals • Worst Case Scenario: • Max metal conc. in dredged material • Max solids at edge of mixing zone
Results for Total Metals • Worst Case Scenario: • Max metal conc. in dredged material • Max solids at edge of mixing zone Result suggests increased potential for impacts from aluminum. But…
Aluminum Criterion is Outdated • EPA acute criterion (1988) is expressed on a total recoverable basis and doesn’t account for pH in a meaningful way. • We know now that aluminum speciation, solubility & toxicity depend on pH. • Fortunately, Al solubility is a minimum between pH 6 & 8 (e.g., solubility at pH 7 = 15.6 ug/L; amounts greater are particulate & non-toxic or less toxic). • The dominant natural mineralogical composition of DE Estuary suspended sediment is alumino-silicate clays. • Aluminum not a problem, criterion is.
What is the Fate of Excavated Metals? • Sediment is excavated from channel bottom & pumped into Kilcohook CDF via pipeline as a slurry. • There are losses to the water column at the cutterhead & from CDF return flows. Primary removal is retention of solids in the CDF. • Mass budget was done to estimate delivery & removal from the Estuary. Also determined if net delivery violates chronic aquatic life criteria & human health criteria upon complete mix (far-field analysis). Kilcohook CDF Into CDF Out of CDF
Results of Metals Mass Budget Reach C • On ave, 96.4% is removed from the Estuary; 3.3% resettles & 0.3% is released to the water as dissolved metal • In absolute terms, >375,000 kg of metals removed, not counting Al, Fe and Mn.
So Does the Release Cause Violations? • The predicted increase in dissolved metal concentrations in Reach C from dredging is at least 3 orders of magnitude less than the dissolved chronic aquatic life criteria. • The predicted increase in total metal concentrations is well below the total human health criteria.
Summary • Metals concentrations tend to be highest in upper Zone 5 and at more shallow, silt dominated stations. Limitation: few to no samples collected upstream for comparison. • EqP modeling of in-place sediments predicts little to no acute toxicity to benthic aquatic life (consistent with prior acute bioassays). • EqP modeling of in-place sediments predicts some limited chronic toxicity to benthic aquatic life (no chronic bioassay data available for comparison). • Mobilization of sediment to the water column during deepening is not expected to cause violations of acute criteria near dredge. Conclusion applies to Reach C. • Dredging/deepening in Reach C removes far more metal contamination from the Estuary than it delivers to the water column & doesn’t cause violations of chronic aquatic life criteria or human health criteria. Again, conclusion applies to Reach C.
Recommendations • Estuary-wide surveys should include the entire Estuary. • Little insight is gained by traditional bulk chemical analysis of metals in sediments. Future sediment testing should consider more detailed metals testing such as AVS-SEM, coupled with chronic bioassays. Bioavailability is key to understanding impacts. • Steer clear of empirically derived SQGs such as ERLs, ERMs, AETs, TELs and PELs for interpreting sediment data. • Sediments are not static but rather are coupled to the water column. Preliminary calculations needed to better understand exchange processes (particle exchange vs diffusion) and role of ETM. • Mercury is a special case because inorganic mercury in sediments gets converted to methylmercury, which then bioaccumulates. A cycling & fate study has been proposed by DNREC to better understand this. • Dredging/deepening: Compare predictions for Reach C to measured values, accounting for background. Also, extend analyses to other reaches and consider a full hydrodynamic & WQ model framework.
Acknowledgements • Summit moderators: interest in topic • Danielle Kreeger & Angela Padeletti, PDE: draft DEBI data • David Wolanski & Bob Scarborough, DNREC: mapping support • Jerry Pasquale, COE and William Burton, Versar: cooperation on Reach C dredging analysis • Tom Fikslin, Namsoo Suk, and Greg Cavallo, DRBC: colleague review of dredging analysis • John Yagecic, DRBC: pH data for the Delaware Estuary
Selected References • Chapra S. 1997. Surface Water-Quality Modeling. McGraw-Hill Companies, Boston, MA. • Di Toro DM, et.al. 2005. Predicting sediment metal toxicity using a sediment biotic ligand model: methodology and initial application. Environ Toxicol Chem 24(10): 2410-2427. • DNREC. 2004. State of Delaware Surface Water Quality Standards as Amended July 11, 2004. Delaware Department of Natural Resources and Environmental Control, Dover, DE. • EPA. 2005a. Partition Coefficients for Metals in Surface Water, Soil, and Waste (EPA/600/R-05/074). U.S. Environmental Protection Agency, Washington, DC. • EPA. 2005b. Procedures for the Derivation of Equilibrium Partitioning Sediment Benchmarks (ESBs) for the Protection of Benthic Organisms: Metal Mixtures (Cadmium, Copper, Lead, Nickel, Silver and Zinc), (EPA/600/R-02/011). U.S. Environmental Protection Agency, Washington, DC. • Greene R. 2009. Reassessment of 1997 NOAA Sediment Metals Data for the Delaware Estuary. Delaware Department of Natural Resources and Environmental Control, Dover, DE. • Greene R. 2010a. An Evaluation of Toxic Contaminants in the Sediments of the Tidal Delaware River and Potential Impacts Resulting from Deepening the Main Navigation Channel in Reach C. Delaware Department of Natural Resources and Environmental Control, Dover, DE. • Greene R. 2010b. Cadmium Freshwater Chronic Criterion Review. Delaware Department of Natural Resources and Environmental Control, Dover, DE. • Hartwell SI, J Hameedi, and M Harmon. 2001. Magnitude and Extent of Contaminated Sediment and Toxicity in Delaware Bay (NOAA Technical Memorandum NOS ORCA 148). National Oceanic and Atmospheric Administration, Silver Spring, MD. • Reinfelder JR and LA Totten. 2006. Mercury in the Delaware River Estuary: Past and Present. Report prepared by The State University of New Jersey Rutgers for the Delaware River Basin Commission, West Trenton, NJ. • Velinsky D, C Sommerfield, and D Charles. 2010. Vertical Profiles of Radioisotopes, Contaminants, Nutrients and Diatoms in Sediment Cores from the Tidal Christina River Basin: A Historical Analysis. Report prepared by The Academy of Natural Science Philadelphia and the University of Delaware for the Delaware Department of Natural Resources and Environmental Control, Dover, DE.