Download
1 / 31
310 likes | 324 Views
The Modelling Process. Dr Andy Evans. This lecture. The modelling process: Identify interesting patterns Build a model of elements you think interact and the processes / decide on variables Verify model Optimise/Calibrate the model Validate the model/Visualisation Sensitivity testing

E N D
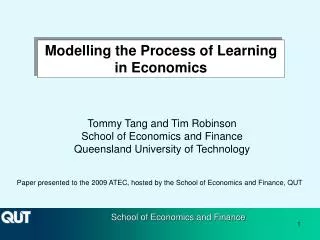
The Modelling Process Dr Andy Evans
This lecture The modelling process: Identify interesting patterns Build a model of elements you think interact and the processes / decide on variables Verify model Optimise/Calibrate the model Validate the model/Visualisation Sensitivity testing Model exploration and prediction Prediction validation
Preparing to model Verification Calibration/Optimisation Validation Sensitivity testing and dealing with error
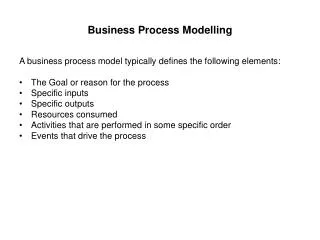
Preparing to model What questions do we want answering? Do we need something more open-ended? Literature review what do we know about fully? what do we know about in sufficient detail? what don't we know about (and does this matter?). What can be simplified, for example, by replacing them with a single number or an AI? Housing model: detail of mortgage rates’ variation with economy, vs. a time-series of data, vs. a single rate figure. It depends on what you want from the model.
Data review Outline the key elements of the system, and compare this with the data you need. What data do you need, what can you do without, and what can't you do without?
Data review Model initialisation Data to get the model replicating reality as it runs. Model calibration Data to adjust variables to replicate reality. Model validation Data to check the model matches reality. Model prediction More initialisation data.
Model design If the model is possible given the data, draw it out in detail. Where do you need detail. Where might you need detail later? Think particularly about the use of interfaces to ensure elements of the model are as loosely tied as possible. Start general and work to the specifics. If you get the generalities flexible and right, the model will have a solid foundation for later.
Model design Person GoHome GoElsewhere Thug Fight Vehicle Refuel Agent Step
Preparing to model Verification Calibration/Optimisation Validation Sensitivity testing and dealing with error
Verification Does your model represent the real system in a rigorous manner without logical inconsistencies that aren't dealt with? For simpler models attempts have been made to automate some of this, but social and environmental models are waaaay too complicated. Verification is therefore largely by checking rulesets with experts, testing with abstract environments, and thorough validation.
Verification Test on abstract environments. Adjust variables to test model elements one at a time and in small subsets. Do the patterns look reasonable? Does causality between variables seem reasonable?
Model runs Is the system stable over time (if expected)? Do you think the model will run to an equilibrium or fluctuate? Is that equilibrium realistic or not?
Calibration Our model will contain variables (“parameters”) we can’t be sure of. Additionally, our model may not match the world perfectly. We may, therefore, need to try lots of values to see which are best: calibration. However, there may be too many to try all of them. Either way, we need to compare our model results with reality: validation.
Preparing to model Verification Calibration/Optimisation Validation Sensitivity testing and dealing with error
Validation Can you quantitatively replicate known data? Important part of calibration and verification as well. Need to decide on what you are interested in looking at. Visual or “face” validation eg. Comparing two city forms. One-number statistic eg. Can you replicate average price? Spatial, temporal, or interaction match eg. Can you model city growth block-by-block?
Validation If we can’t get an exact prediction, what standard can we judge against? Randomisation of the elements of the prediction. eg. Can we do better at geographical prediction of urban areas than randomly throwing them at a map. Doesn’t seem fair as the model has a head start if initialised with real data. Business-as-usual If we can’t do better than no prediction, we’re not doing very well. But, this assumes no known growth, which the model may not.
Total Absolute Error If we’re just predicting values. Just take values in one dataset from another, and sum the absolute differences.
Comparison stats: space and class Could compare number of geographical predictions that are right against chance randomly right: Kappa stat. Construct a confusion matrix / contingency table: for each area, what category is it in really, and in the prediction. Fraction of agreement = (10 + 20) / (10 + 5 + 15 + 20) = 0.6 Probability Predicted A = (10 + 15) / (10 + 5 + 15 + 20) = 0.5 Probability Real A = (10 + 5) / (10 + 5 + 15 + 20) = 0.3 Probability of random agreement on A = 0.3 * 0.5 = 0.15
Comparison stats Equivalents for B: Probability Predicted B = (5 + 20) / (10 + 5 + 15 + 20) = 0.5 Probability Real B = (15 + 20) / (10 + 5 + 15 + 20) = 0.7 Probability of random agreement on B = 0.5 * 0.7 = 0.35 Probability of not agreeing = 1- 0.35 = 0.65 Total probability of random agreement = 0.15 + 0.35 = 0.5 Total probability of not random agreement = 1 – (0.15 + 0.35) = 0.5 κ = fraction of agreement - probability of random agreement probability of not agreeing randomly = 0.1 / 0.50 = 0.2
Comparison stats Tricky to interpret
Comparison stats The problem is that you are predicting in geographical space and time as well as categories. Which is a better prediction?
Comparison stats The solution is a fuzzy category statistic and/or multiscale examination of the differences (Costanza, 1989). Scan across the real and predicted map with a larger and larger window, recalculating the statistics at each scale. See which scale has the strongest correlation between them – this will be the best scale the model predicts at? The trouble is, scaling correlation statistics up will always increase correlation coefficients.
Dog walkers Road accidents Correlation and scale Correlation coefficients tend to increase with the scale of aggregations. Robinson (1950) compared illiteracy in those defined as in ethnic minorities in the US census. Found high correlation in large geographical zones, less at state level, but none at individual level. Ethnic minorities lived in high illiteracy areas, but weren’t necessarily illiterate themselves. More generally, areas of effect overlap:
Comparison stats So, we need to make a judgement – best possible prediction for the best possible resolution.
Comparison stats: Graph / SIM flows Make an origin-destination matrix for model and reality. Compare the two using some difference statistic. Only problem is all the zero origins/destinations, which tend to reduce the significance of the statistics, not least if they give an infinite percentage increase in flow. Knudsen and Fotheringham (1986) test a number of different statistics and suggest Standardised Root Mean Squared Error is the most robust.
Preparing to model Verification Calibration/Optimisation Validation Sensitivity testing and dealing with error
Errors Model errors Data errors: Errors in the real world Errors in the model Ideally we need to know if the model is a reasonable version of reality. We also need to know how it will respond to minor errors in the input data.
Sensitivity testing Tweak key variables in a minor way to see how the model responds. The model maybe ergodic, that is, insensitive to starting conditions after a long enough run. If the model does respond strongly is this how the real system might respond, or is it a model artefact? If it responds strongly what does this say about the potential errors that might creep into predictions if your initial data isn't perfectly accurate? Is error propagation a problem? Where is the homeostasis?
Prediction If the model is deterministic, one run will be much like another. If the model is stochastic (ie. includes some randomisation), you’ll need to run in multiple times. In addition, if you’re not sure about the inputs/parameters, you may need to vary them to cope with the uncertainty: Monte Carlo testing runs 1000’s of models with a variety of potential inputs, and generates probabilistic answers.
Analysis Models aren’t just about prediction. They can be about experimenting with ideas. They can be about testing ideas/logic of theories. They can be to hold ideas.