Download
1 / 15
200 likes | 597 Views
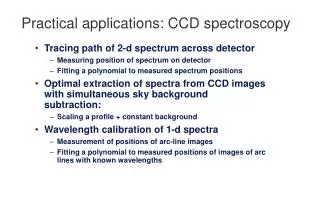
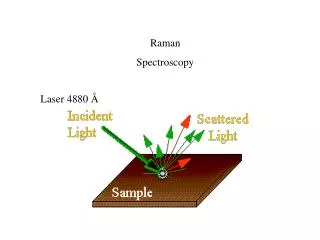
Practical Applications of Raman Spectroscopy for Process Analysis. Brian J. Marquardt, Charles Branham and David J. Veltkamp Center for Process Analytical Chemistry University of Washington Bernd Wittgens SINTEF, Trondheim, Norway. Absorption process for removal of CO 2 from flue gas. Cold.

E N D
Practical Applications of Raman Spectroscopy for Process Analysis Brian J. Marquardt, Charles Branham and David J. Veltkamp Center for Process Analytical Chemistry University of Washington Bernd Wittgens SINTEF, Trondheim, Norway
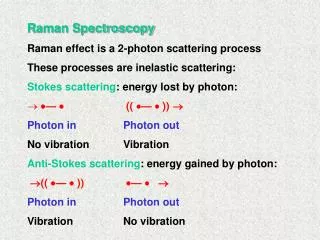
Absorption process for removal of CO2 from flue gas Cold 2 MEA + CO2 MEACOO- + MEAH+ Hot
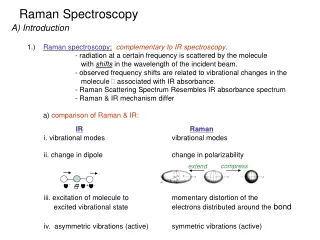
Why is this reaction important? • Environmental implications of CO2 release from the burning of fossil fuels • Need for efficient chemical processing to effectively reduce excess stack emissions into the environment • Raman could be a useful tool for monitoring the absorption of C02 and absorbent performance in real-time for process control • Can Raman be an effective sensor for monitoring both gas emission (CO2, SO2, …) and absorbent quality/capacity simultaneously in a wet scrubber to improve efficiency and control?
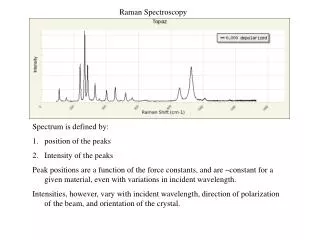
Currently, the reaction is modeled based on the CO2 concentration in the gas phase. The equilibrium reactions in the liquid phase are: CO2 + 2 MEAMEAH++MEACOO- CO2 + H2O H2CO3 H+ + HCO3- 2 H+ + CO32- For a > 0,5 MEACOO-+ H2O HCO3- + MEAH+ Equilibrium of MEA and CO2 MEA, CO2, H2O 10000 8000 Intensity (counts) Intensity (counts) Intensity (counts) 3000 2000 ) 1 - 2500 2500 2000 3000 ) 1 - 2500 3000 3000 2500 2000 2000 Raman Shift (cm 2000 4000 Raman Shift (cm 0 1500 4000 500 0 2000 2000 1500 1000 1000 0 0 1000 500 0 1500 0 1500 500 0 500 1000 0 2000 4000 4000 6000 MEA, CO2, H2O, HCO3-, CO3-, MEACOO-, MEAH+ • Diethylanolamine Methyl • Methyl Ethanolamine Water Diethylanolamine • Methyl • Methyl Ethanolamine Water • • 8000 10000 12000 8000 6000 12000 10000 6000 6000 10000 8000 12000 10000 8000 12000 6000 4000 2000 0 0 500 500 1000 1000 1500 1500 2000 2000 2500 2500 3000 Raman Shift (cm-1) Raman Shift (cm-1)
Raman Analysis of Gas/Liquid Reactor at Ambient and Elevated Pressure Evaluate Raman as an online tool for evaluating gas scrubber absorbent performance Experiments were performed in a gas/liquid reactor at ambient and elevated pressures Efficient and reproducible sampling was needed to interrogate both the liquid and gas phases of the reaction
Experimental • 785 nm Raman System • Ballprobe connected inline with high pressure fitting • Laser power = 160 mW at sample, -50º C detector temp. • Exposure time 6 sec, 5 accums./spectrum (30 sec/spectrum) • Charge reactor with 20 mL of absorbent and H2O • Mono ethanolamine (MEA) • Methyl-di-ethanolamine (MDEA) • Bubble CO2 gas at pressure through absorbent while collecting Raman data • Pressure range 5 – 60 psi CO2 / 0.35 – 4.13 bar(g) • Monitor reaction with Raman to determine absorbent CO2 saturation point at a given partial pressure of CO2
Gas/Liquid Reactor Setup Ballprobe Liquid Inlet Gas Inlet
Raman Sampling Probe Sapphire lens Focus point Fibreoptic Stainless steal probe
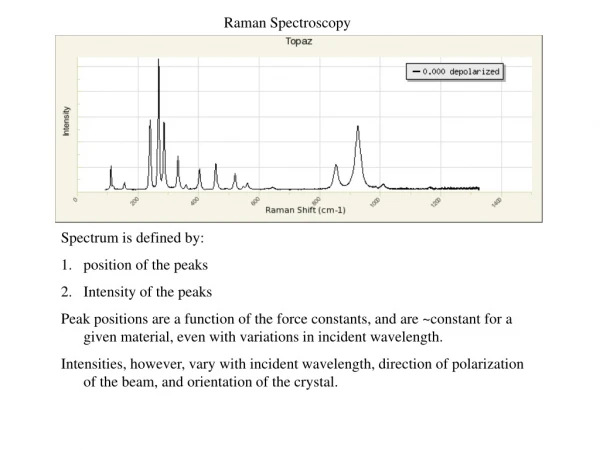
12000 • Water • Mono Ethanolamine (MEA) • Methyl-di-ethanolamine (MDEA) 10000 8000 6000 Intensity (counts) 4000 2000 0 0 500 1000 1500 2000 2500 3000 Raman Shift (cm-1) Raman Spectra: Pure components Raman Shift (cm-1)
Raman Spectra: Absorption mixtures • 70% Water - 30% MEA • 70% Water - 22% MEA – 8% MDEA 3000 Intensity (counts) 2000 1000 0 0 500 1000 1500 2000 2500 3000 Raman Shift (cm-1) Raman Shift (cm-1)
MEA, Water and CO2 - Challenge: Comparison of standards to reaction 12000 • Water • MEA • Time • 2.5 • 10 • 30 • 50 10000 8000 Intensity (counts) 6000 4000 2000 0 Sapphire 0 1000 1500 2000 2500 3000 500 Raman Shift (cm-1) Raman Shift (cm-1)
MEA, Water and CO2 - Pressure step 10/0.69 ,32/2.2 and 58/3.99 psi/bar(g) 7000 PCA Analysis of ROI • 0 psi • 10 psi • 32 psi • 58 psi • 58 psi (no flow) 6000 5000 4000 Intensity (counts) 3000 2000 1000 0 0 500 1000 1500 2000 2500 3000 Raman Shift (cm-1) Raman Shift (cm-1)
CO2 and MEA at 30 psi / 2.1 bar(g) • Time (min) • 2.5 • 10 • 17 • 25 • 40 • 47 • 55 PCA Analysis of ROI 6000 5000 4000 Intensity (counts) 3000 2000 1000 0 0 500 1000 2000 2500 3000 1500 Raman Shift (cm-1) Raman Shift (cm-1)
Summary • Initial experiments indicate that Raman is an effective analysis tool for following these CO2 absorption reactions • More experiments need to be performed to evaluate and modify the reactor to ensure good gas mixing with the liquid absorbent • Problems with foaming and liquid evacuating the cell • By optimizing the reactor system it should improve the reproducibility of both the reaction and the optical sampling and lead to more consistent results • A successful demonstration of Raman applied to a liquid/gas reactor to improve process control of a reaction at moderate pressure
Future work • Calibration for online detection of amine concentrations • Identification of species in reactions • Identify relation between reaction kinetics and observed results from PCA • Utilize GC for online sampling of CO2 inlet and outlet concentration • Apply in-situ fluorescence sensor or FT-IR for gas analysis