Download
1 / 15
150 likes | 311 Views
Optical properties of lattice-mismatched semiconductors for thermo-photovoltaic cells. TIM GFROERER, Davidson College Davidson, NC USA in collaboration with the National Renewable Energy Laboratory, USA Supported by Research Corporation and the Petroleum Research Fund. Outline.

E N D
Optical properties of lattice-mismatched semiconductors for thermo-photovoltaic cells TIM GFROERER, Davidson CollegeDavidson, NC USA in collaboration with the National Renewable Energy Laboratory, USA Supported by Research Corporation and the Petroleum Research Fund
Outline • Motivation • Sample Structure and Experimental technique • Results and Analysis • Conclusions and Future Work
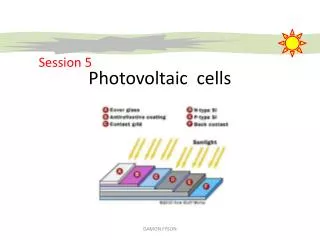
Motivation: Thermophotovoltaic (TPV) Power Heat Blackbody Radiation Semiconductor TPV Converter Cells Heat Source Blackbody Radiator TPV Cells are designed to convert infrared blackbody radiation into electricity.
Motivation (continued) Bandgap vs. Alloy Composition Blackbody Radiation Absorbed Increasing the Indium concentration in the InGaAs lowers the bandgap and increases the fraction of blackbody radiation that is absorbed in the cell.
Eg(x) x y m n 0.73 eV 0.47 0 0 0 0.65 eV 0.40 0.14 -0.46 2 0.60 eV 0.34 0.27 -0.87 4 0.55 eV 0.28 0.40 -1.28 6 0.50 eV 0.22 0.53 -1.69 8 Sample Structure Nominal Epistructure Parameters Active Layer Active Layer m = Total Mismatch (%) InAsP grading layers above the substrate are used to reduce the density of misfit dislocations at the interfaces of the active layer.
Experimental Setup Laser Diode 1 Watt @ 980 nm Photodiode Cryostat @ 77K Lowpass Filter Sample ND Filters : Laser Light : Luminescence
Experimental Data Photoluminescence intensity (normalized by the excitation power) vs. the rate of electron-hole pair generation and recombination in steady state.
Results: Data Calibration Data from Eg = 0.73 eV Sample Derivatives of Best-Fit Curve The derivatives show where the curvature of the relative efficiency inflects. We scale the relative efficiency to 50% absolute efficiency at the infection point.
A Simple Theoretical Model Efficiency = Where A = SRH Coefficient, B = Radiative Coefficient and n = Carrier Density
Defect-related vs. Radiative Rate @ 50% Radiative Efficiency, n = A/B ________________ Total Rate @ 50% Efficiency = An + Bn2 = 2A2/B Exceeding a threshold mismatch of ~1% increases the defect-related rate relative to the radiative rate.
Shape of the Efficiency Curve Lattice-matched case Lattice-mismatched case While the simple theory fits well in the lattice-matched case, the model does not fit the shape of the efficiency curve in the mismatched samples.
Defect-related Density of States Distribution of defect levels in simple theory Distribution of defect levels in better theory valence band edge conduction band edge valence band edge conduction band edge
A Better Theoretical Fit The addition of band-edge exponential tails to the density of defect states gives a much better fit.
Conclusions • Moderate mismatch does not increase defect-related recombination relative to the radiative rate in these structures. Large mismatch has an appreciable effect on this ratio. • The threshold that distinguishes these two regimes is approximately 1% lattice mismatch. • The shape of the efficiency curve in all mismatched samples differs from the lattice-matched case. • The change is attributed to a re-distribution of defect levels within the gap.
Future Work • Continue fitting low temperature efficiency curves to more detailed theory accounting for the distribution of energy levels at defects. • Compare results with complementary transport measurements including photoconductivity and DLTS. • Connect defect-related density of states with the microscopic structure of defects. • Measure efficiency curves at higher temperatures to further characterize defect-related, radiative, and Auger recombination.