Download

1 / 30
300 likes | 427 Views
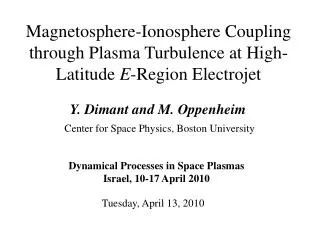
Coupling Study of Mid-latitude E- and F-region Irregularities over Japan. M. Yamamoto, T. Yokoyama*, A. Maegawa, S. Fukao Research Institute for Sustainable Humanosphere (RISH) Kyoto University (*Now at STE Lab., Nagoya Univ.). E- and F-region Coupling

E N D
Coupling Study of Mid-latitude E- and F-region Irregularities over Japan M. Yamamoto, T. Yokoyama*, A. Maegawa, S. Fukao Research Institute for Sustainable Humanosphere (RISH) Kyoto University (*Now at STE Lab., Nagoya Univ.)
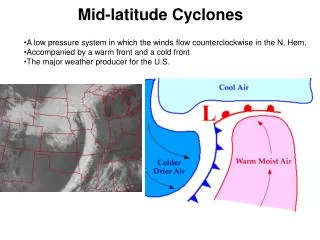
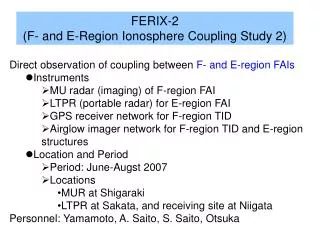
E- and F-region Coupling • Couplings occur through polarization electric-field mapping. • Observations in the past • Comparison of F-region TID and Sporadic-E (Es) layer • Ionosonde traces for E- and F-regions [e.g., Chen et al., 1972] • 630 nm airglow image Es-layer patch [Kelley et al., 2003] • Theoretical study • Perkins instability (F-region) Azimuth-dependent Es-layer instability (E-region) [Cosgrove et al., 2004] FERIX (F- and E-Region Ionosphere Coupling Study) • Direct observation of coupling between F- and E-region FAIs • Instruments • MU radar for F-region FAI • LTPR (portable radar) for E-region FAI • GPS receiver network for F-region TID • Airglow imager network for F-region TID and E-region structures • Ionosonde network for spread-F and basic ionosphere parameters • Location and Period • E- and F-region over Japan-sea. • Observation regions are connected by the geomagnetic field. • Period: June-Augst 2004
Perkins instability and Es-layer instability North • Perkins instability is expected as a source of F-region irregularities. But the growth rate is very small. • Azimuth dependent Es-layer instability proposed by Cosgrove has large growth rate. • Both instabilities assume NW-SE phase front orientation. Both growth with polarization electric fields. • Coupling of two mechanisms through propagation of polarization electric field can enhance growth rate of the Perkins instability by a factor of 5. Es-layer instability is also enhanced. • Couplings most efficiently occur when phase speed of both structures match. F-region E-region Cosgrove et al., 2004
FERIX experiment in June-August 2004 Simultaneous observation of FAI along the same geomagnetic field. F-region: MU radar E-region: LTPR (FAI = Field Aligned Irregularity) B-field LTPR in Sakata • MU radar (F-region FAI) • 16 beam experiment (green line) • 3 beam Doppler experiment • June-August 2004, 29 nights LTPR in Sakata MU radar MU radar in Shigaraki • LTPR (E-region FAI) • Beam direction: Northwest • Interferometry capability • Every-night run Steer 16 beams in different azimuth angles, and detect F-region echoes that appears perpendicular direction to the geomagnetic field. The same as the MU radar, but detect echoes from the E-region FAI. Spatial distribution of echoes are determined by interferometry. Project F-region FAI (250-350km) and E-region FAI (100-120 km) along the geomagnetic field (B) for comparisons
北 9 m 30° 9 m Antenna Beam AZ = - 60 deg. 9 m 9 m 2 1 9 m 14 m 0 9 m 90° 14 m 4 4 2 1 0 3 3 LTPR hut LTPR (Lower Thermosphere Profiler Radar) Sakata setup for FERIX in 2004 (This is the same radar as used in SEEK-2)
North Azimuth-elevation distribution SNR > 20 dB Interferometry result of E-region FAI echoes from Sakata Red curve:Field perpendicularity at 100 km height. 60° • E-region FAI echoes from Sakata appeared at 100– 110 km height, and distributed wide in azimuth direction. • Positive range-rate of the echoes corresponds to westward motion of the echoes. Blue Beam direction: AZ = - 60 deg. Green West Zenith Red Range-height distribution Height (km) SNR > 20 dB Range (km)
June 18, 2004 (Case with MUR + LTPR)a • E-region and F-region echoes are well co-located when mapped along the B-field. • Both echoes propagated to the west or southwest with similar phase velocity. Color dotts: E-region FAIs seen from Sakata Black dotts: F-region FAIs seen from the MU radar (Projected to 100 km height along the B-field) Square: Maximum view of E-region FAIs from Sakata PDF1 PDF2
June 16, 2004 (Case with MUR + LTPR + GPS) • F-region FAIs appeared in the TEC depletion of MS-TID. (reported by Saito et al.) • E-region FAIs appeared apart from the field perpendicularity, clustered with ~50 km scale. Color: GPS-TEC pattern (fluctuation) Black: F-FAI from the MU radar All projected to 300 km height along B field.
June 14, 2004 (Case without F-region FAI) • No F-region FAIs were found from the MU radar observations. • E-region FAIs appeared only close to the field perpendicularity. E-region
Relationship between E/F-region FAI echoes June 2004 E-FAI F-FAI July 2004 E-FAI F-FAI E-FAI of SNR > 20dB Appears after 22LT August 2004 F-FAI echoes found from the MU radar E-FAI F-FAI ×:No valid data ×:Echo regions mismatch F-region FAIs exist, and can be mapped to the observation region of E-region FAIs along the field line: 9 cases. Both echoes are in good association: 7 cases.
Summary • Occurrence of E-FAIwas almost every night, and seen independent of F-FAI. • E-FAI without F-FAI distributed along the field-perpendicular line (east-west) at 110 km height. • When F-FAI occurred, E-FAI was usually intense, and was found at the field associated region, and more structured (= distributed apart from the field-perpendicular line). Both FAIs propagated westward with similar velocity. • NW-SE phase-front structures were common while the coupling occurred. • F-FAI showed association with TID in GPS-TEC. More F-FAIs were seen in TEC depleted region (but complicated).
Statistical comparison between E-region FAI and F-region GPS-TEC fluctuation(Observations over Shigaraki in 2005) Purpose Study condition for E- F-region coupling from long-term observation data. pTEC From GPS-TEC E -FAI activity Method E -region:E –FAI observation with LTPR in Shigaraki F-region: GPS-TEC fluctuation (pTEC) in F-region Comparisons were conducted along the geomagnetic field E s parameter RED---foEs GREEN---fbEs ◇---Es height
E -FAI – pTEC relationship Most cases were categorized in case A. Case A
Case D E -FAI – pTEC relation Most cases were categorized in case A.
Case C F –region is active +Es-layer exists, but no E –FAI. E -FAI – pTEC relation Most cases were categorized in case A.
Case B F –region is active +Es-layer exists, but no E –FAI. Only E-FAI occured. F-region was inactive. E -FAI – pTEC relation Most cases were categorized in case A.
Case E F –region is active +Es-layer exists, but no E –FAI. Only E-FAI occured. F-region was inactive. E -FAI – pTEC relation Most cases were categorized in case A.
Comparison of MSTID structure between Case A and Case C Determine phase-front orientation of pTEC (10-min average) Determine orientation of phase from ACF ACF calculation X pTEC over Shigaraki Occurrence frequency of phase-front orientation Phase-front distribution is narrow in 110-140 deg. (NW-SE) for Case A Consistent with phase-front of Perkins instability. Case C Case A
MSTID structure for Case B (E-FAI structure during the SEEK-2 rocket experiment) • Intense polarization electric fields were observed with SEEK-2 rocket. Larch wind shear was observed from TMA experiment. • E –FAI echoes were intense with QP structures, but they showed NE-SW phase-front…Very different from coupling case. pTEC over shigaraki at the SEEK-2 rocket launch did not show clear NW-SE oriented MSTID pattern. In this case, E –FAI echoes and QP structures should be attributed to fluctuations of the neutral atmosphere. …Consistent result with SEEK-2 studies. MSTID (pTEC) phase-front orientation during the SEEK-2 rocket experiment.
Conclusion FERIX Campaign in 2004 F -FAI • With the MU radar and LTPR, we could observe direct evidence of E –FAI and F –FAI coupling for the first time. • Echo region, phase orientation, propagation speed matched along the geomagnetic field line. Westward propataion at the same speed. Small structures. NW-SE phase front E -FAI Statistical study between E-FAI and GPS-TEC in 2005 • Comparison between E –FAI and pTEC over Shigaraki. • NW-SE phase-front were more enhanced when E- and F-region coupling was clearly seen. • E-FAI can be associated to E-region only as ween in the SEEK-2 case. pTEC MSTID phase-front orientation was 20-50 deg. west from the north. E -FAI
F-AIとTECの比較 2004.8.16の例 • F-FAIがTECの極大域と重なる。 • E-FAIは磁力線直交線上にまとまって並んでいる。
F-FAIとTECの比較 2004.6.19の例 • F-FAIは0050LT付近を境にTECとの対応関係が変わる。 • 前半はTEC極小域、後半はTEC極大域。 • E-FAIの特徴の違い。 • 前半は小さな構造でF-FAIと重なっている。 • 後半は磁力線直交線上にまとまって分布。
E-FAIとTECの比較 2004.6.12の例 • F-FAIがない日についてE-FAIとTECの領域比較を行った。 • E-FAIを磁力線に沿ってTECのプロット高度300kmまで持ち上げた。 • 最初東西に長く延びていた構造が北西に傾いた構造になり南西へ移動。 • TECの極小域との対応が見られる。
観測小屋 受信機 送信機 アンテナ データ解析PC データ取得PC LTPRについて 方位角-60°では高度100kmにおいて磁力線と直交する仰角が20.48°と低くなるのでレンジを長くした。
2004.6.18の観測結果 • E-FAIは2341LTにはほぼ110kmの磁力線直交線上に位置する。 • F-FAIの発生、移動に伴いE-FAIは形を変え、ともに移動する。 • 両領域のエコーはほぼ同じ位相速度であり約90m/sであった。
2004.8.16の観測結果 • 2303LTに大部分のE-FAIは110kmの磁力線直交線上に位置していた。 • 2312LT以降しばらくしてE-FAIが消えF-FAIが現れる。 • 酒田からの観測視野から外れた可能性 • エコーが弱まった可能性 • 全体を通してE-FAI、F-FAIともに西へ伝搬していた。
2004.6.16の観測結果 • 6/18同様、最初E-FAIは磁力線直交線上に東西方向に約200kmにわたって分布し、F-FAIの出現に伴い小さな構造に形を変え、ともに動く。
FERIXキャンペーンのまとめ E -FAIとF -FAIの磁力線を介した相互作用の観測に初めて成功した。 • F -FAIの存在にかかわらず、E -FAIは発生する。 • F -FAIのないときのE -FAIは東西方向に長く分布し、大きな位置の変動も見られない。 • F -FAI、E -FAIの相互関係が確認できた。 • お互いに等しい速度で西方へ伝搬した • カップリング時のE -FAIエコー強度は強い。 • 北西-南東の構造を持つと見なせる例しばしば見つかった。 • F -FAIがpTECの極小域に対応している例が多く、pTECは北西-南東の構造を持っていた。 Es層不安定とPerkins不安定との相互結合に関する理論考察(Cosgrove., et al 2004)の指摘とよく一致する。