Download
1 / 14
140 likes | 141 Views
Chapter 5: Exponential and Logarithmic Functions. 5.1 Inverse Functions 5.2 Exponential Functions 5.3 Logarithms and Their Properties 5.4 Logarithmic Functions 5.5 Exponential and Logarithmic Equations and Inequalities

E N D
Chapter 5: Exponential and Logarithmic Functions 5.1 Inverse Functions 5.2 Exponential Functions 5.3 Logarithms and Their Properties 5.4 Logarithmic Functions 5.5 Exponential and Logarithmic Equations and Inequalities 5.6 Further Applications and Modeling with Exponential and Logarithmic Functions
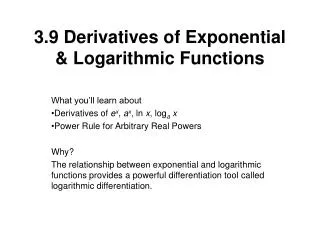
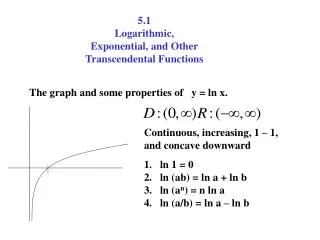
5.4 Logarithmic Functions • The function f(x) = ax, a 1, is one-to-one and thus has an inverse. • The logarithmic function with base a and the exponential function with base a are inverse functions. So,
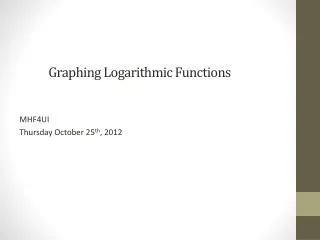
5.4 Graphs of Logarithmic Functions • Recall that the graph of the inverse function is reflexive about the line y = x. • The figure above is the typical shape for such graphs where a > 1 (includes base e and base 10 graphs).
5.4 Graphs of Logarithmic Functions • Below are typical shapes for such graphs where 0 < a < 1.
5.4 Determining Domains of Logarithmic Functions Example Find the domain of each function. Solution • Argument of the logarithm must be positive. x – 1 > 0, or x > 1. The domain is (1,). • Use the sign graph to solve x2 – 4 > 0. The domain is (–,–2) (2, ).
5.4 Graphing Translated Logarithmic Functions Example Give the domain, range, asymptote, and x-intercept. (a) Solution • The argument x – 1 shifts the graph of y = log2 x 1 unit to the right. • Vertical asymptote: x = 1 • x-intercept: (2,0) • Domain: (1,), Range: (–, )
5.4 Graphing Translated Logarithmic Functions • Here, 1 is subtracted from y = log3 x shifting it down 1 unit. • Vertical asymptote: y-axis (or x = 0) • x-intercept : (3,0) • Domain: (0,), Range: (–, )
5.4 Determining Symmetry Example Show analytically that the graph of is symmetric with respect to the y-axis. Solution Since f(x) = f(–x), the graph is symmetric with respect to the y-axis.
5.4 Finding the Inverse of an Exponential Function Example Find the inverse function of Solution Replace f(x) with y. Interchange x and y. Isolate the exponential. Write in logarithmic form. Replace y with f–1(x).
5.4 Logarithmic Model: Modeling Drug Concentration Example The concentration of a drug injected into the bloodstream decreases with time. The intervals of time in hours when the drug should be administered are given by where k is a constant determined by the drug in use, C2 is the concentration at which the drug is harmful, and C1 is the concentration below which the drug is ineffective. Thus, if T = 4, the drug should be administered every 4 hours. For a certain drug, k = C2 = 5, and C1 = 2. How often should the drug be administered?
5.4 Logarithmic Model: Modeling Drug Concentration Solution Substitute the given values into the equation. The drug should be given about every 2.75 hours.