Download
1 / 38
380 likes | 473 Views
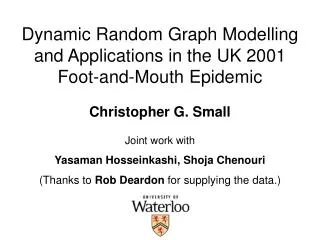
The construction and analysis of epidemic trees with reference to the 2001 UK FMDV outbreak Dan Haydon, Dept Zoology, University of Guelph, On. Ca. Provide case reproduction ratios from outbreak data as it arises Explore the consequences of applying stricter control measures

E N D
The construction and analysis of epidemic trees with reference to the 2001 UK FMDV outbreak Dan Haydon, Dept Zoology, University of Guelph, On. Ca.
Provide case reproduction ratios • from outbreak data as it arises • Explore the consequences of • applying stricter control measures • Woolhouse, MEJ., Topping, M.C., Haydon, D.T. and 8 others. 2001. Foot-and-mouth disease under control in the UK. • Nature 411, 258-259. • Haydon, D.T., Topping, M.C., Shaw, D.J., Matthews, L., Friar, J.K., Wilesmith, J., and Woolhouse, M.E.J. • 2003. The construction and analysis of epidemic trees with reference to the 2001 UK foot-and-mouth outbreak. • Proceedings: Biological Sciences (The Royal Society, UK) 270, 121-127.
∞ skiing Move to Guelph Number of infected premises
Always pick the closest Pick candidates with equal probability Pick candidates with probabiltiy weighted by distance 1.5 km 0.5 km 13 km 3 km 3 km 5 km Reporting date Culling date Infection date time
1 7 0 0 0 0 0 1 4 1 0 1 0 0 0 0 0 time
Estimated parent infection date Parent reporting date Daughter reporting date Parent Infected – daughter reporting interval time
60% 93%
Time 20th Feb.
NMB Time 23rd Feb. 20th Feb.
NMB X X Time 23rd Feb. 20th Feb.
NMB Time 23rd Feb. 20th Feb.
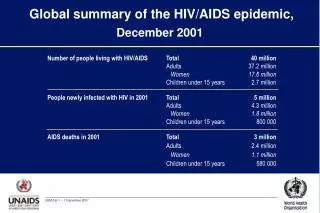
Between 20th – evening of 23rd of February: • 17 IPs infected at distance greater than 20km • 16 of these IPs have positive contact tracing • 13 were infected by animal movements from markets
NMB Time 23rd Feb. 20th Feb.
NMB X X Time 23rd Feb. 20th Feb.
NMB Time 23rd Feb. 20th Feb.
Time 20th Feb.
The government, however, dismisses Woolhouse's figures as an overestimate. It also argues that it could not have acted any faster than it did. "A national ban was imposed as soon as it became clear that there was a national problem," a spokesman for the Department for Environment Food and Rural Affairs told New Scientist. But he did add that such a ban would be imposed immediately if any future outbreak occurred. New Scientist vol. 176 issue 2372 (07 December 2002)
What the foot and mouth virus looks like (not actual size)
1.5% yr-1 1.0% yr-1 1.4% yr-1 1.1% yr-1 1.0% yr-1 0.4% yr-1
WITHIN HOST POPULATION DYNAMICS Assume: Simple exponential population growth Simple Poisson mutation process (no back mutation) Mutants are either tolerated and equally fit as wildtype or not tolerated at all Wildtype virus Mutant virus Haydon, D.T., Samuel, A.R., and Knowles, N.J. (2001). The generation and persistence of genetic variation in foot-and-mouth disease virus. Preventative Veterinary Medicine 51, 111-124.
The fraction of mutant capsid genes in an infected animal? 10-3 10-4 Error Rate (per base per replication cycle) 10-5 10-6 0 10 20 30 40 50 Viral Generations (t)
observed rates of change in the field are 0.5 - 1.5 % yr-1 • corresponding to 10 - 30 nucleotide changes in • capsids genes yr-1 • plausible that the bulk of virus excreted by infected • animals differs by at least one point mutation to capsid • genes from that which ‘went in’ • therefore sequential chains of infection of 10 - 30 • animals yr-1 could give rise to observed rates of change
Uncertainty surrounds many of the critical parameters governing the generation of genetic variation during a single infection In particular: • the mutation rate • the number of viral generations • the viability of variants However, if variation is generated at the rate anticipated, then transmission networks may be traced at a much finer resolution than practiced to date
Introduce infection Group 1 Group 2 Group 3 Group 4 Hughes,G.J., Mioulet, V., Haydon, D.T., Kitching, P.R., Donaldson, A.I., and Woolhouse, M.E.J. (2002). Serial passage of foot-and-mouth disease virus in sheep reveals declining levels of viraemia through time. Journal of General Virology 83, 1907-1914.
Inoculum Group 1 Group 2 Group 3 Group 4 23 487 23 487 577 23 487 577 99 91 83 07 NOT DONE 82 06 98 90 23 487 577 23 NOT DONE NOT DONE 89 05 97 81 23 487 NOT DONE NOT DONE NOT DONE 23 487 577 Inoculum a 88 80 96 04 Ø NOT INFECTED NOT INFECTED NOT DONE 95 487 231,2 487 5771,2 Inoculum b 03 87 79 231,2 487 NOT INFECTED 487 94 23 487 02 86 78 231,2 487 23 487 577 NOT INFECTED 487 01 85 93 77 NOT INFECTED NOT INFECTED NOT INFECTED 00 84 92 76 23 487 577 NOT DONE NOT INFECTED NOT INFECTED