Download
1 / 15
150 likes | 154 Views
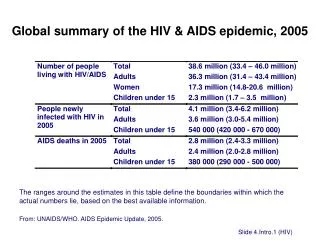
Global summary of the HIV/AIDS epidemic, December 2001. Number of people living with HIV/AIDS Total 40 million Adults 37.2 million Women 17.6 million Children under 15 years 2.7 million

E N D
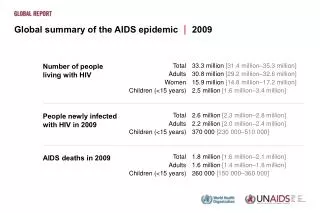
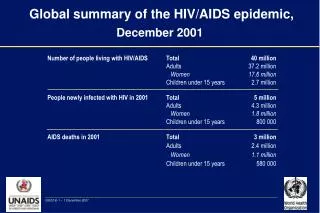
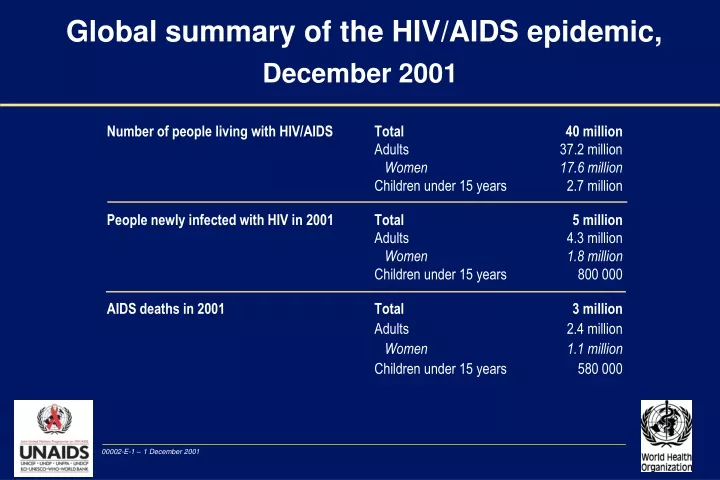
Global summary of the HIV/AIDS epidemic, December 2001 Number of people living with HIV/AIDS Total 40 millionAdults 37.2 millionWomen 17.6 million Children under 15 years 2.7 million People newly infected with HIV in 2001 Total 5 millionAdults 4.3 millionWomen 1.8 million Children under 15 years 800 000 AIDS deaths in 2001 Total 3 millionAdults 2.4 millionWomen 1.1 million Children under 15 years 580 000
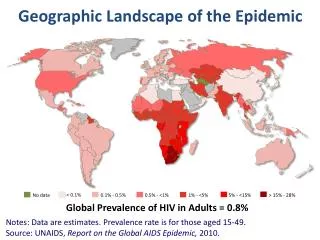
Adults and children estimated to be living with HIV/AIDS as of end 2001 Eastern Europe & Central Asia 1 million Western Europe 560 000 North America 940 000 East Asia & Pacific 1 million North Africa & Middle East 440 000 South & South-East Asia 6.1 million Caribbean 420 000 Sub-Saharan Africa 28.1 million Latin America 1.4 million Australia & New Zealand 15 000 Total: 40 million
Estimated adult and child deaths from HIV/AIDS during 2001 Eastern Europe & Central Asia 23 000 Western Europe 6 800 North America 20 000 East Asia & Pacific 35 000 North Africa & Middle East 30 000 South & South-East Asia 400 000 Caribbean 30 000 Sub-Saharan Africa 2.3 million Latin America 80 000 Australia & New Zealand 120 Total: 3 million
Children(<15 years)estimated to be living with HIV/AIDS as of end 2001 Eastern Europe & Central Asia 15 000 Western Europe 4 000 North America 10 000 East Asia & Pacific 7 000 North Africa & Middle East 20 000 South & South-East Asia 200 000 Caribbean 20 000 sub-Saharan Africa 2.4 million Latin America 40 000 Australia & New Zealand < 200 Total: 2.7 million
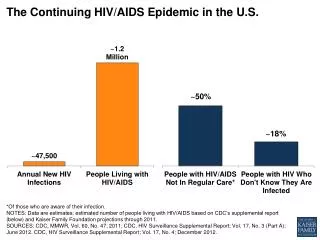
About 14 000 new HIV infections a day in 2001 • More than 95% are in developing countries • 2000 are in children under 15 years of age • About 12 000 are in persons aged 15 to 49 years, of whom: • almost 50% are women • about 50% are 15–24 year olds
Regional HIV/AIDS statistics and features, end of 2001 % of HIV-positive adults who are women Main mode(s) of transmission for those living with HIV/AIDS ** Adults & children newly infected with HIV Epidemic started Adults & children living with HIV/AIDS Adult prevalence rate * 28.1 million 440 000 6.1 million 1 million 1.4 million 420 000 1 million 560 000 940 000 15 000 40 million late ’70s early ’80s late ’80s late ’80s late ’80s late ’70s early ’80s late ’70s early ’80s early ’90s late ’70s early ’80s late ’70s early ’80s late ’70s early ’80s 3.4 million 80 000 800 000 270 000 130 000 60 000 250 000 30 000 45 000 500 5 million 8.4% 0.2% 0.6% 0.1% 0.5% 2.2% 0.5% 0.3% 0.6% 0.1% 1.2% 55% 40% 35% 20% 30% 50% 20% 25% 20% 10% 48% Hetero Hetero, IDU Hetero, IDU IDU, Hetero, MSM MSM, IDU, Hetero Hetero, MSM IDU MSM, IDU MSM, IDU, Hetero MSM Sub-Saharan Africa North Africa & Middle East South and South-East Asia East Asia & Pacific Latin America Caribbean Eastern Europe & Central Asia Western Europe North America Australia & New Zealand TOTAL * The proportion of adults (15 to 49 years of age) living with HIV/AIDS in 2001, using 2001 population numbers ** Hetero: heterosexual transmission – IDU: transmission through injecting drug use – MSM: sexual transmission among men who have sex with men
Changes in life expectancy in selected African countries with high HIV prevalence, 1950 to 2000 65 60 Botswana Uganda 55 South-Africa Life expectancy at birth, in years Zambia 50 Zimbabwe 45 40 35 1950-55 1955-60 1960-65 1965-70 1970-75 1975-80 1980-85 1985-90 1990-95 1995-00 Source: United Nations Population Division, 1998
Increase in mortality among men between 15 and 60, selected African countries, 1986-1997 80 estimated for 6 years before survey estimated for year of survey 70 60 50 Probability of dying from all causes 40 30 20 10 0 Tanzania, 1996 Malawi, 1992 Zimbabwe, 1994 Uganda, 1995 Zambia, 1996-97 Source: Timaeus I, AIDS 1998, 12 (suppl): S15-S27
Lifetime risk of AIDS death for 15-year-old boys, assuming unchanged or halved risk of becoming infected with HIV, selected countries 100% 90% Botswana 80% Zimbabwe 70% Botswana South Africa Risk of dying of AIDS Zambia 60% Zimbabwe 50% Kenya South Africa risk halved over next 15 years Zambia Côte d’Ivoire 40% current level of risk maintained Cambodia Kenya 30% Côte d’Ivoire Burkina Faso 20% Cambodia Burkina Faso 10% 0% 0% 5% 10% 15% 20% 25% 30% 35% 40% Current adult HIV prevalence rate Source: Zaba B, 2000 (unpublished data)
Projected population structure with and without the AIDS epidemic, Botswana, 2020 80 Projected population structure in 2020 75 70 Males Females Deficits due to AIDS 65 60 55 50 Age in years 45 40 35 30 25 20 15 10 5 0 140 120 100 80 60 40 20 0 0 20 40 60 80 100 120 140 Population (thousands) Source: US Census Bureau, World Population Profile 2000
HIV prevalence among pregnant womenin South Africa, 1990 to 1999 25 22.8 22.4 20 17 14.2 15 HIV prevalence (%) 10.4 10 7.6 5 4 2.1 1.7 0.7 0 90 91 92 93 94 95 96 97 98 99 Source: Department of Health, South Africa
Predicted loss in life expectancy due to HIV/AIDS in children born in 2000 Predicted life expectancy Loss in life expectancy due to HIV/AIDS Botswana Zimbabwe South Africa Kenya Zambia Côte d'Ivoire Rwanda Mozambique Haiti Cambodia 0 10 20 30 40 50 60 70 Life expectancy at birth (years) Source: U.S. Census Bureau, 2000
Impact of HIV/AIDS on urban households, Côte d’Ivoire General population Families living with AIDS 30 000 Francs CFA 25 000 Monthly income per capita 20 000 15 000 Monthly consumption per capita 10 000 5 000 Savings/Disavings 0 – 5 000 Source: Simulation-based on data from Bechu, Delcroix and Guillaume, 1997
Reduction in production in a household with an AIDS death, Zimbabwe Reduction in output 61% 47% 49% 37% 29% Crops • Maize • Cotton • Vegetables • Groundnuts • Cattle owned Source: Stover & Bollinger, 1999
Affordable prices Annual cost per person for triple therapy in Africa (US$) $12,000 $10,000 $8,000 $6,000 $4,000 $2,000 $0 Drug Access Initiative Domestic production Accelerated access initiative February-April 2001 offers 1991 1993 1995 1997 1999 2001 2003