Download
1 / 21
210 likes | 325 Views
U.S. National Agricultural Land Cover Monitoring. Rick Mueller USDA/National Agricultural Statistics Service IEEE IGARSS July 28, 2011. Agenda. Cropland Data Layer (CDL) Intro CDL Inputs Method Accuracy Assessment Acreage Estimation Summary. ~9 billion pixels!. Inputs:

E N D
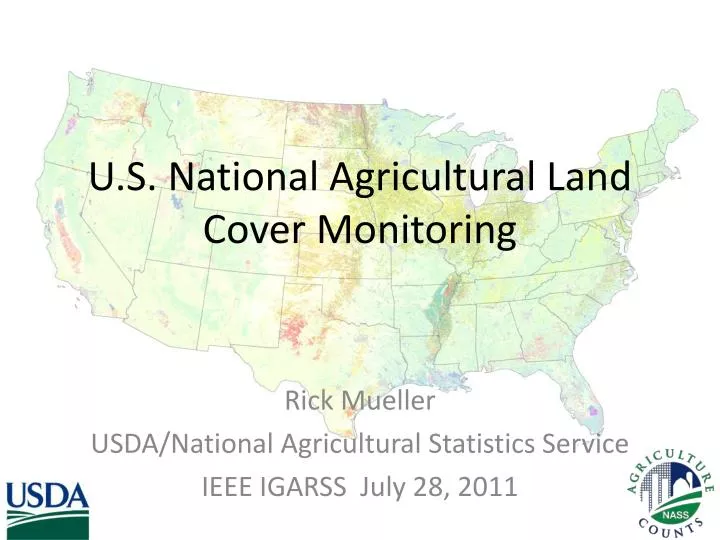
U.S. National Agricultural Land Cover Monitoring Rick Mueller USDA/National Agricultural Statistics Service IEEE IGARSS July 28, 2011
Agenda • Cropland Data Layer (CDL) Intro • CDL Inputs • Method • Accuracy Assessment • Acreage Estimation • Summary
~9 billion pixels! Inputs: Landsat (8601 scenes) AWiFS (1194 scenes) Released Jan. 10, 2011 National 30m Product
http://nassdata.gmu.edu/CropScape Harmonize ALL historical CDL products to standards: color scheme, categories, projection, metadata
Cropland Data Layer (CDL) Objectives • Annually cover major crops for conterminous United States • Potential adjusted Ag Census @ .22 acre/pixel scale • Deliver in-season remote sensing acreage estimates • For June, August, September, and October Official Reports • Update planted area/survey variance reduction • Reduce respondent burden • Basis for crop progress/condition/yield program monitoring • Provide timely, accurate, useful estimates • Measurable error • Unbiased/independent estimator • State, District, County
14 states – winter wheat 14 – corn & soybeans 15 – rice, cotton & peanuts 17 – all small grains 24 – all crops 27 – operational Cropland Data Layer 2010 in-season production @ 56m 48 states post season @ 30m
2010 Cropland Data Layer Inputs Satellite Imagery - AWiFS & Landsat TM USDA Farm Service Agency/Common Land Unit NLCD & Derivative products NASS June Agricultural Survey
Ground Truth – Land Cover Agriculture Ground Truth Non-Agriculture Ground Truth U.S. Geological Survey National Land Cover Dataset Identifies urban infrastructure and non-agriculture land cover Forest, grass, water, cities Provided by Farm Service Agency Identifies known fields and crops Divide known fields into 2 sets 70% used for training software 30% used for validating results
Satellite Data with Farm Service Agency Common Land Unit (CLU) Polygons
Satellite Data with Farm Service Agency CLUs Overlay Corn - Soybean - Winter Wheat - Alfalfa -
Kansas 2010 CDL Input Layers AWiFS AWiFS AWiFS TM TM TM TM MODIS DEM Canopy Impervious Scenes of data actually used: 24 AWiFS, 13 Landsat TM, 2 MODIS NDVI, DEM, Canopy, and Impervious
Classification Methodology Overview • “Stack” Landsat, Landsat-like data, and ancillary data layers within a raster GIS • Sample spatially through stack from known ground truth from FSA (ag. categories) and NLCD (non-ag. categories) • “Data-mine” those samples using Boosted Classification Tree Analysis to derive best fitting decision rules • Apply derived decision rules back to entire input data stack to create full scene classification Agricultural ground truth (via the USDA Farm Service Agency) Non-agricultural ground truth (using the National Land Cover Dataset as a proxy) (dependent data) Manages and visualizes datasets Output “Cropland Data Layer” Rulequest See5.0 Derives decision tree-based classification rules Imagery stack (independent data) Generated rule set
CDL Accuracy Assessment Each classification tested against independent set of ground truth data to determine overall and within class accuracies Example classification subset Example validation subset
Accuracy Statistics Producer’s Accuracy: relates to the probability that a ground truth pixel will be correctly mapped and measures errors of omission. Errors of Omission: occur when a pixel is excluded from the correct category User’s Accuracy: indicates the probability that a pixel from the classification actually matches the ground truth data and measures errors of commission Errors of Commission: occur when a pixel is included in an incorrect category
Regression-based Acreage Estimator Acreage not just about counting pixels Simple Linear Regression Regression used to relate categorized pixel counts to the ground reference data • (X) – Cropland Data Layer (CDL) classified acres • (Y) – June Agricultural Survey (JAS) reported acres Outlier segment detection - removal from regression analysis Using regression results in estimates reduces error rates over using JAS alone Estimate 17 crops in 39 states
Washington - June Winter Wheat – Stratum 11 R² Jun – 0.769
Washington - September Winter Wheat – Stratum 11 R² Jun – 0.769 Sep – 0.883
Washington - October Winter Wheat – Stratum 11 R² Jun – 0.769 Sep – 0.883 Oct – 0.890
Cropland Data Layer Summary • Operational Program • Timely estimate delivery • Measureable statistical error • Set national/regional/county acreage estimates • Components • AWiFS/Landsat imagery • Farm Service Agency/Common Land Unit • USGS NLCD/ancillary layers • June Agricultural Survey • Leverage • CDL program paramount to other NASS geospatial activities • Partnerships with cooperating agencies critical for success • Heavy reliance on satellites and information technology • Distribution • CropScape Portal • NRCS Data Gateway
Spatial Analysis Research Section USDA/NASS R&D Division Thank you! nassgeodata.gmu.edu/CropScape