Download
1 / 18
190 likes | 217 Views
U.S. Agricultural Policy. Joseph W. Glauber U.S. Department of Agriculture Silverado Symposium on Agricultural Policy Reform / Napa, California /January 20, 2004. Farm and Food Trade Policy: Historical overview. 1982 – 1998: Budget deficits => farm program reforms => trade liberalization

E N D
U.S. Agricultural Policy Joseph W. Glauber U.S. Department of Agriculture Silverado Symposium on Agricultural Policy Reform / Napa, California /January 20, 2004
Farm and Food Trade Policy: Historical overview • 1982 – 1998: Budget deficits => farm program reforms => trade liberalization • 1998 – 2002: Budget surpluses => farm program retrenchment => disenchantment with trade policy • Post 2002: Return of budget deficits => renewed pressures on farm programs (?) => renewed interest in trade (?)
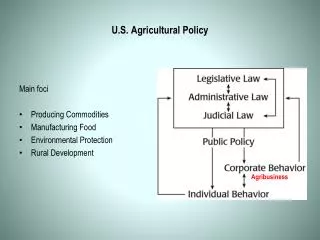
Trends in U.S. Commodity Programs, 1985-2001 • Deregulation of supply • Decoupling payments from price and production • Market oriented support levels
Criticisms of 2002 Farm Bill • Increased level of support and broadening of scope of support • Re-coupling of payments to price through counter-cyclical payments • Re-coupling of payments to production through base and yield updating
WTO Implications • Level of support • Classification of support: • Amber vs blue vs green • Product specific vs non-product specific
Classification Issues • Amber—product specific • Price support (dairy, sugar) ($5-6 billion) • Loan deficiency payments ($8-9 billion) • Amber—non-product specific • Credit, water • Crop insurance • Market loss assistance/counter-cyclical payments => Below de minimis levels (5% of value of all ag prod) • Green • PFC/Direct payments
Doha Development Round • US proposal • Harmonizing cut in domestic support • Elimination of blue box • Elimination of export subsidies • Swiss formula for tariff reductions • Harbinson • EU/US paper
Cancun Text—Domestic Support • Significant reduction in AMS • Product specific AMS capped • Reduction in de minimis • Modify and cap blue box • Fixed area and yield • Capped at 5% of total value of ag production w/ further annual reductions • Cap on AMS + Blue +de minimis w/ further annual reductions
Implications for U.S. Domestic Support Commitments ($ bil) 1/ 5% of value of total agricultural production.
Domestic Support with 50% AMS Reduction Cap at 2000 levels
Domestic Policy Options to Meet New Support Commitments • Reduce loan rates • Dairy and sugar: $5-6 billion • Decrease loan rates => lower LDPs • Increase Direct Payment rates => Green • Maintain current DP rates => increase CCP => “New” Blue box
Other Policy Considerations • Payment limitations: LDP vs DP/CCP • Opposition to further decoupling (e.g., Texas rice producers) • Budget implications-- DP vs LDPs
Conclusions • Cancun text could lead to substantial reduction in trade distorting support • Would require US to make significant modifications in support (e.g., loan rates) • But would allow for continuation of decoupled income support