Download
1 / 15

E N D
While it is often said that the world is awash in data, informed decision-making can occur only when data are transparent and readily available to the stakeholders that need the information. Our Shared Seas is a website platform which seeks to roll up relevant ocean conservation data in a centralized, easy-to-use platform, providing authoritative data and sensemaking of ocean trends. • The purpose of this project is to aggregate ocean statistics and trends to support the marine conservation community—including funders, advocates, practitioners, and policymakers—in making better, faster, and more informed decisions. In 2017, the David and Lucile Packard Foundation commissioned CEA Consulting to prepare Our Shared Seas: A 2017 Overview of Ocean Threats and Conservation Funding as a primer on the primary ocean threats, trends, and solutions. As a second edition of the original narrative report, the 2019 edition takes the form of a website is which provides updated figures and share key data points in a format that is easy to digest and use for external purposes. • Visitors are welcome to download both individual charts directly from the site and PowerPoint decks for external use, provided that corresponding references are cited. • This deck serves as a companion piece to the Our Shared Seas website. Readers are encouraged to visit the website for additional data and analysis at www.OurSharedSeas.com.
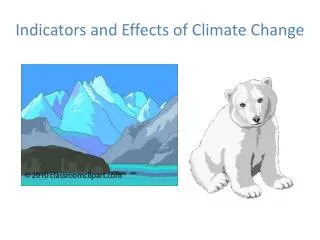
Climate Change: Indicators of a Changing Climate Global CO2 emissions have risen steadily in recent decades. Between 2008 and 2017, fossil fuel CO2 emissions increased at a rate of 1.5 percent per year.As of early 2019, CO2 emissions had reached 410 parts per million (ppm). Carbon dioxide (direct measurement) Source: "Global Climate Change: Evidence." NASA Global Climate Change and Global Warming: Vital Signs of the Planet. January 15, 2019. Accessed January 20, 2019. http://climate.nasa.gov/evidence/.
Climate Change: Indicators of a Changing Climate Current policies are expected to lead to warming of 3.3 degrees Celsius by 2100; under business-as-usual, warming is projected to reach over 4 degrees Celsius by 2100. At current rates of warming, it is projected that the world will reach the 1.5-degree threshold between 2030 and 2052. Greenhouse gas emissions: warming projected by 2100 Expected global temperature increase by 2100 compared to pre-industrial levels implied by global emissions pathways for the following scenarios: BAU (‘no-policy’ or ‘reference’ scenario), current policies, current pledges and targets, and emissions compatible with warming of 1.5 degrees Celsius and 2 degrees Celsius, respectively. Ranges indicate uncertainty in emissions projections; dotted lines indicate median (50 percent) levels within these ranges. Source: Adapted from Climate Action Tracker. “Warming Projections Global Update.” December 2018. https://climateactiontracker.org/documents/507/CAT_2018-12-11_Briefing_WarmingProjectionsGlobalUpdate_Dec2018.pdf. (Accessed January 10, 2019.)
Climate Change: Indicators of a Changing Climate The year 2018 set a new record of ocean heating. The past five years (2014 to 2018) have ranked as the five warmest years for ocean heat content, confirming a trend that ocean warming has been accelerating since the 1990s. New research suggests that the rate of ocean warming is much faster than previously predicted. A series of analyses indicate that the ocean is absorbing excess heat 40 percent faster than the IPCC estimated in its Fifth Assessment Report in 2013 Global ocean heat content Source: Cheng L. et al. “Improved Estimates of Ocean Heat Content from 1960 to 2015.” Science Advances 3, no. 3 (March 2017): e1601545. https://doi.org/10.1126/sciadv.1601545; Cheng L. et al. “2018 Continues Record Global Ocean Warming.” Advances in Atmospheric Science, 36, no. 3, (2019: 249-252, Doi: 10.1007/s00376-019-8276-x.
Climate Change: Indicators of a Changing Climate The average global sea surface temperature—the temperature from the upper few meters of the ocean—has risen about 0.12 degrees Celsius per decade over the past 50 years, with a higher rate of warming in recent years. These higher temperatures are contributing to: mass bleaching of coral reefs, die offs of other ecosystems with low thermal sensitivity (such as kelp and intertidal communities), shifts in fisheries stocks due to temperature, a reduction in algae productivity, and more frequent and intense extreme weather events. Global ocean temperature anomaly This graph shows how the average surface temperature of the ocean has changed since 1880. Source: NOAA National Centers for Environmental Information. “Global Marine Data,” updated February 2019. www.ncdc.noaa.gov/data-access/marineocean-data/extended-reconstructed-sea-surface-temperature-ersst. (Accessed February 10, 2019).
Climate Change: Indicators of a Changing Climate Globally, the annual risk of coral reef bleaching has increased from 8 percent in the early 1980s to 31 percent in 2016. The time between recurrent events has also become too short to allow sufficient time for recovery.Whereas the time between recurrent severe bleaching events was 27 years in the early 1980s, this window is now only 6 years. (Typically it takes 10 to 15 years for the fastest-growing corals to recover from a severe bleaching event.) Cumulative bleaching on the Great Barrier Reef Each dot represents the most severe bleaching score recorded from 1998 to 2017 on individual reefs following each of four major beaching events, in 1998, 2002, 2016 and 2017. Successive maps include earlier bleaching records to illustrate the expanding cumulative footprint through time. Red (>60% of colonies bleached); Orange (30 to 60%). Source: Hughes, T., J.T. Kerry, S.R. Connolly, A.H. Baird, C.M. Eakin, S.F. Heron, A. Hoey, M. Hoogenboom, M. Jacobson, G. Liu, M.S. Pratchett, W. Skirving, and G. Torda. “Ecological memory modifies the cumulative impact of recurrent climate extremes.” Nature Climate Change 9 (2018). doi.10.1038/s41558-018-0351.
Climate Change: Indicators of a Changing Climate An estimated 30-60 percent of coral reefs have died since preindustrial times. Even if the goals of the Paris Climate Agreement are achieved (of limiting temperature to below 2 degrees Celsius), roughly 70 to 90 percent of current distribution of coral reef habitat will disappear by 2050.A failure to achieve the Paris Agreement will result in a near total loss of coral reefs by mid-century. Global extent of mass bleaching of corals in 2015 and 2016 Symbols show 100 reef locations that were assessed. Red circles indicate severe bleaching affecting >30% of corals; orange circles indicate moderate bleaching affecting (less than) 30 percent of corals; and blue circles indicate no substantial bleaching records. Source: Hughes, T. et al. “Spatial and temporal patterns of mass bleaching of corals in the Anthropocene.” Science 359 (2018): 80-83. DOI: 10.1126/science.aan8048.
Climate Change: Indicators of a Changing Climate The rate of global sea-level rise nearly doubled from 1.7 mm annually throughout most of the 20th century to 3.1 mm (0.12 inch) per year since 1993. About one-third of the rise in global sea level has been caused by the thermal expansion of water. The increase in ocean heat in 2018 led to a 29.5 millimeter (1.2 inches) global mean sea-level rise above the 1981–2010 average.Sea-level rise is further exacerbated by melting of ice sheets in the polar regions. Global sea level change (satellite observations) Note: The satellite data is averaged per year. Source: Nerem, R. S., B. D. Beckley, J. T. Fasullo, B. Hamlington, D. Masters, and G. T. Mitchum. “Climate-change–driven accelerated sea-level rise detected in the altimeter era.” PNAS 115 (2018): 2022-2025. https://doi.org/10.1073/pnas.1717312115.
Climate Change: Indicators of a Changing Climate Since 2012, the amount of annual ice loss in Antarctica has tripled, increasing the global sea level by 3 millimeters (0.12 inch). By 2100, global sea level could rise 65 centimeters (21 inches) if the rate of sea-level rise continues to accelerate at the observed rate; ice melt from Antarctica could account for nearly 25 percent of this rise. Antarctic ice sheet contribution to global sea level Adapted from Changes in the Antarctic ice sheet’s contribution to global sea level, 1992 to 2017. Credit: IMBIE/Planetary Visions. Source: NASA. “Ramp-up in Antarctic ice loss speeds sea-level rise.” June 13, 2018, https://climate.nasa.gov/news/2749/ramp-up-in-antarctic-ice-loss-speeds-sea-level-rise/.
Climate Change: Shifting distribution of marine species One study projects that new transboundary stocks will be present in ~30 percent of global EEZs by 2100. As waters warm due to climate change, fish and other marine species are migrating into new territory, usually poleward, at a rate averaging 70 km (43 mi) per decade. EEZs projected to contain one or more fishery stocks by 2100 Compared to fishery distribution in 1950–2014. Projections represent an ensemble average across three models under the high emissions scenario (RCP 8.5). Source: Pinsky, Malin L., Gabriel Reygondeau, Richard Caddell, Juliano Palacios-Abrantes, Jessica Spijkers, and William W. L. Cheung. “Preparing Ocean Governance for Species on the Move.” Science 360, no. 6394 (June 15, 2018): 1189–91. https://doi.org/10.1126/science.aat2360.
Climate Change: Emissions contribution of marine industries Emissions from the global fishing industry increased by 28 percent between 1990 and 2011while average emissions per ton of landed seafood product grew by 21 percent. Increased harvest from fuel-intensive crustacean fisheries primarily drove this growth in emissions. Capacity-enhancing fuel subsidies and growth in distant water fishing have also contributed to the fishing sector’s trend of increased emissions. Global marine fishery landings and GHG emissions (1990-2011) The chart is shown categorized by species groups: a) global marine fishery landings, and b) global GHG emissions from marine fisheries. Source: Parker, Robert W. R., Julia L. Blanchard, Caleb Gardner, Bridget S. Green, Klaas Hartmann, Peter H. Tyedmers, and Reg A. Watson. “Fuel Use and Greenhouse Gas Emissions of World Fisheries.” Nature Climate Change 8, no. 4 (April 2018): 333–37. https://doi.org/10.1038/s41558-018-0117-x.
Climate Change: Warming scenarios A recent IPCC report examined the consequences of a future with warming of 1.5 or 2 degrees Celsius.While both scenarios would heavily impact the ocean, a half degree of warming will lead to vastly different futures for natural and human communities. By 2100, Arctic summers could be ice-free once a decade in a world with 2 degrees of warming, or once a century under 1.5 degrees of warming. Nearly all of coral reefs could be irreversibly destroyed under 2 degrees of warming, or 10 to 30 percent may persist if warming is limited to 1.5 degrees Celsius. Impacts associated with 1.5 and 2-degrees Celsius temperature increase Source: IPCC. “Summary for Policymakers. In: Global Warming of 1.5°C. An IPCC Special Report on the impacts of global warming of 1.5°C above pre-industrial levels and related global greenhouse gas emission pathways, in the context of strengthening the global response to the threat of climate change, sustainable development, and efforts to eradicate poverty.” [Masson-Delmotte, V., P. Zhai, H.-O. Pörtner, D. Roberts, J. Skea, P.R. Shukla, A. Pirani, W. Moufouma-Okia, C. Péan, R. Pidcock, S. Connors, J.B.R. Matthews, Y. Chen, X. Zhou, M.I. Gomis, E. Lonnoy, T. Maycock, M. Tignor, and T. Waterfield (eds.)]. World Meteorological Organization, Geneva, Switzerland, 2018, 32 pp.
Climate Change: Warming scenarios New research suggests that as compared to a high-emissions scenario of 3.5 degrees Celsius, achieving the Paris Agreement would result in significant benefits for ocean productivity, economies, and human communities. Limiting warming to 1.5°C could increase global fishers’ revenues by USD 13.1 billion annually (due to higher fish biomass and ocean productivity), raise seafood workers’ income by USD 10.6 billion, and reduce household seafood expenditures by USD 18.3 billion. Projected gains in Maximum Catch Potential under Paris Agreement targets, by country and continent Projected gains in Maximum Catch Potential (relative to the 2001–2010 period) if Paris Agreement targets are met (1.5°C relative to 3.5°C warming) and the 2015 CO2 emissions by (A) country and (B) continent. Larger point size indicates a greater proportion of protein derived from seafood, while the vertical line represents the median per capita CO2 emission levels. Note the log scale for CO2 emissions. Source: Sumaila, R. et al. “Benefits of the Paris Agreement to ocean life, economies, and people.” Science Advances 5, no. 2 (2019). DOI: 10.1126/sciadv.aau3855.
The David and Lucile Packard Foundation is a private family foundation created in 1964 by David Packard (1912–1996), cofounder of the Hewlett-Packard Company, and Lucile Salter Packard (1914–1987). The Foundation provides grants to nonprofit organizations in the following program areas: Conservation and Science; Population and Reproductive Health; Children, Families, and Communities; and Local Grantmaking. The Foundation makes national and international grants and also has a special focus on the Northern California counties of San Benito, San Mateo, Santa Clara, Santa Cruz and Monterey. Today, the Packard Foundation’s ocean investments are focused in six countries and on a suite of global strategies that together offer great potential for accelerating positive change. Learn more at www.packard.org. Since 1984, California Environmental Associates (CEA) has supported the work of environmental foundations and nonprofits as well as sustainability-oriented businesses with in-depth research and analysis, program design and evaluation, and strategic planning. Learn more at www.ceaconsulting.com. Please use the following citation when referencing this project as a body of work: CEA Consulting. 2019. “Our Shared Seas: Global ocean data and trends for informed action and decision-making.”