Download
1 / 46
460 likes | 465 Views
Special-topic Lecture Bioinformatics: Modeling Cell Fate. Leistungspunkte/Credit points: 5 (V2/Ü1) This course is taught in English language. The material (from books and original literature) are provided online at the course website:

E N D
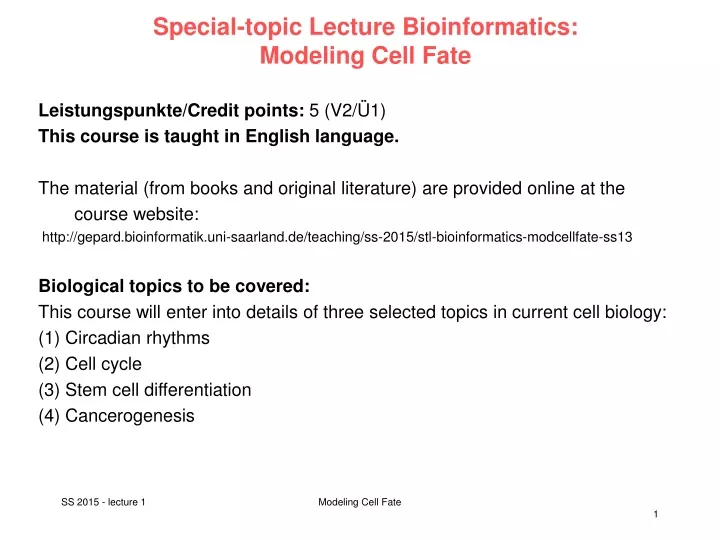
Special-topic Lecture Bioinformatics: Modeling Cell Fate Leistungspunkte/Credit points: 5 (V2/Ü1) This course is taught in English language. The material (from books and original literature) are provided online at the course website: http://gepard.bioinformatik.uni-saarland.de/teaching/ss-2015/stl-bioinformatics-modcellfate-ss13 Biological topics to be covered: This course will enter into details of three selected topics in current cell biology: (1) Circadian rhythms (2) Cell cycle (3) Stem cell differentiation (4) Cancerogenesis Modeling Cell Fate
Bioinformatics content • microarray expression analysis • DNA methylation analysis • GO and pathway annotation • interaction networks • application of clustering techniques • construction of gene-regulatory networks • stochastic simulations • time series analysis Modeling Cell Fate
Aim of this lecture, „Lernziele“ (1) The aim of this course is not to fully cover these four topics but to enter deeply into various details of these fields. (2) This course should train you to analyze original biological data using modern bioinformatics tools. (3) You shoud also become familiar with the biological processes (pathways) controlling cellular adaptation / cell fate. (4) Also, you will get a routine in reading original research publications. Modeling Cell Fate
Tutorial We will handout 6 biweekly assignments. Groups of up to two students can hand in a solved assignment. Send your solutions by e-mail to the responsible tutors : Thorsten Will, Maryam Nazarieh, Daria (?) until the time+date indicated on the assignment sheet. The tutorial on Tuesdays 12.45 pm - 2 pm will provide help to understand the papers and the assignment solutions. Schein condition 1 Only those students can get a „Schein“ who have obtained more than 50% of the points for all assignments. Modeling Cell Fate
Schein = pass 3 written tests Schein condition 2 The successful participation in the lecture course („Schein“) will be certified upon fulfilling Schein condition 1 and upon successful completion of 3 written 45 minute tests. Each test roughly covers the content of one of the three lecture topics. Dates: probably at the beginning of lectures V5, V9, V13. All students registered for the course may participate in the tests. 2 out of 3 tests have to be passed. The final grade on the Schein is the average of your 2 best tests. Rounding scheme: (1.0 + 1.3 -> 1.0 ; 1.3 + 2.0 -> 1.7) Modeling Cell Fate
written tests The tests will cover the lecture material (slides on the lecture website) and the theory behind the assignments for this topic. In case of illness please send E-mail to: kerstin.gronow-p@bioinformatik.uni-saarland.de and provide a medical certificate. Those who miss or fail one test, will be given a second-chance oral exam. If you fail or miss more than two tests, you cannot get a Schein. Modeling Cell Fate
Gene Transcription etc. Basic terms that you should remember from an introductory genetics lecture ... or that you should read up: Genome Genes Introns, Exons Nucleus DNA-Polymerase Transcription mRNA Splicing Ribosome tRNA Translation Modeling Cell Fate
A biological cell Schematicoftypicalanimalcell, showingsubcellularcomponents. Organelles: (1) nucleolus (2) nucleus (3) ribosome (4) vesicle (5) rough endoplasmic reticulum (ER) (6) Golgi apparatus (7) Cytoskeleton (8) smooth ER (9) mitochondria (10) vacuole (11) cytoplasm (12) lysosome (13) centrioles HeLa cells stained for DNA with the blue Hoechst dye. The central and rightmost cell are in interphase, thus their entire nuclei are labeled. On the left a cell is going through mitosis and its DNA has condensed ready for division. wikipedia.org Modeling Cell Fate
cell cycle The cell cycle, or cell-division cycle, is the series of events that takes place in a cell leading to its division and duplication (replication). In cells without a nucleus (prokaryotes), the cell cycle occurs via a process termed binary fission. In cells with a nucleus (eukaryotes), the cell cycle can be divided in 2 brief periods: interphase—during which the cell grows, accumulating nutrients needed for mitosis and duplicating its DNA—and the mitosis (M) phase, during which the cell splits itself into two distinct cells, often called "daughter cells". www.wikipedia.org Modeling Cell Fate
Phases The cell cycle consists of 4 distinct phases: - G1 phase, - S phase (synthesis), • G2 phase • and M phase (mitosis). Interphase: combines G1, S, and G2 The activation of each phase is dependent on the proper progression and completion of the previous one. Cells that have temporarily or reversibly stopped dividing are said to have entered a state of quiescence called G0 phase. Schematic of the cell cycle. Outer ring: I = Interphase, M = Mitosis; Inner ring: M = Mitosis, G1 = Gap 1, G2 = Gap 2, S = Synthesis. www.wikipedia.org Modeling Cell Fate
Activity during 4 phases M phase itself is composed of 2 tightly coupled processes: - mitosis, in which the cell's chromosomes are divided between the two daughter cells, and - cytokinesis, in which the cell's cytoplasm divides in half forming distinct cells. www.wikipedia.org Modeling Cell Fate
Cellular differentiation Differentiation is a key example of cell fate. Differentiation does not depend on mutations. So how does a cell know in which state it is? -> This is controlled by epigenetic modifications of the genome Modeling Cell Fate
Hematopoiesis: development of blood cells Orkin & Zon, Cell (2008) 132: 631–644. Modeling Cell Fate
The Hallmarks of Cancer Robert A. Weinberg Modeling Cell Fate
The Hallmarks of Cancer Modeling Cell Fate
The Hallmarks of Cancer Modeling Cell Fate
Number of somatic mutations in human cancers Top: children vs. adults Numbers in parentheses : median number of nonsynonymous mutations per tumor. MSI, microsatellite instability; SCLC, small cell lung cancers; NSCLC, non–small cell lung cancers; ESCC, esophageal squamous cell carcinomas; MSS, microsatellite stable; EAC, esophageal adenocarcinomas. B Vogelstein et al. Science 2013; 339:1546-1558 Modeling Cell Fate
Progression of colorectal cancer The major signaling pathways that drive tumorigenesis are shown at the transitions between each tumor stage. One of several driver genes that encode components of these pathways can be altered in any individual tumor Patient age indicates the time intervals during which the driver genes are usually mutated. TGF-β, transforming growth factor–β. B Vogelstein et al. Science 2013; 339:1546-1558 Modeling Cell Fate
Alterations affecting protein-coding genes SBS: single-base substitutions (SBS), Indels: small insertions and deletions, B Vogelstein et al. Science 2013; 339:1546-1558 Modeling Cell Fate
Mutations in oncogenes and tumor suppressor genes PIK3CA (phosphatidylinositol-4,5-bisphosphate 3-kinase, catalytic subunit alpha) IDH1: Isocitrate dehydrogenase 1 RB1: retinoblastoma protein VHL: Von Hippel–Lindau tumor suppressor Oncogenes PIK3CA and IDH1: missense mutations accumulate at identical positions, (almost) no truncation mutations tumor suppressor genes RB1 and VHL: truncating mutations and missense mutations spread over the entire genes B Vogelstein et al. Science 2013; 339:1546-1558 Modeling Cell Fate
Number of driver gene mutations per tumor B Vogelstein et al. Science 2013; 339:1546-1558 Modeling Cell Fate
Genetic heterogeneity in tumors heterogeneity among different metastatic lesions in the same patient Example: primary tumor in the pancreas and its metastatic lesions in the liver. Mutations introduced during primary tumor cell growth result in clonal heterogeneity. A typical tumor is represented by cells with a large fraction of the total mutations (founder cells) from which subclones are derived. The differently colored regions in the subclones represent stages of evolution within a subclone. heterogeneity among the cells of the primary tumor. heterogeneity among the cells of each metastasis develops as the metastases grow heterogeneity among the tumors of different patients. The mutations are almost completely distinct. B Vogelstein et al. Science 2013; 339:1546-1558 Modeling Cell Fate
Cancer driver genes belong to 12 pathways Cancer cell signaling pathways and the cellular processes they regulate. All known driver genes can be classified into one or more of 12 pathways (middle ring). All these pathways confer a selective growth advantage. The pathways can themselves be further organized into 3 core cellular processes (outer ring). B Vogelstein et al. Science 2013; 339:1546-1558 Modeling Cell Fate
Signal transduction pathways affected by mutations in human cancer Two representative pathways (RAS and PI3K) are illustrated. The signal transducers are color coded: red indicates protein components encoded by the driver genes; yellow balls : sites of phosphorylation. Stick models: therapeutic agents that target some of the signal transducers. RTK, receptor tyrosine kinase; GDP, guanosine diphosphate; MEK, MAPK kinase; ERK, extracellular signal–regulated kinase; NFkB, nuclear factor κB; mTOR, mammalian target of rapamycin. B Vogelstein et al. Science 2013; 339:1546-1558 Modeling Cell Fate
Circadian clocks in mammals and plants Most organisms (animals, plants, fungi and cyanobacteria) enhance their fitness by coordinating their development with daily environmental changes through molecular timekeepers (circadian clocks) Mammals display circadian rhythms in behavioural and physiological processes, such as - sleep - feeding - blood pressure and - metabolism Roles in plants e.g.: - opening of flowers in the morning and their closure at night Circadian rhythms are guided by external light–dark signals that are integrated through intrinsic central and peripheral molecular clocks McClung Plant Cell 18, 792 (2006) Modeling Cell Fate 25
Circadian rhythms (1) Circadian rhythms are the subset of biological rhythms with period of 24 h. The term circadian combines the Latin words ‘‘circa’’ (about) and ‘‘dies’’ (day). (2) Circadian rhythms are endogenously generated and self-sustaining. They persist under constant environmental conditions, typically constant light (or dark) and constant temperature. Under these controlled conditions, the free-running period of 24 h is observed. (3) For all circadian rhythms the period remains relatively constant over a range of ambient temperatures. This is thought to be one property of a general mechanism that buffers the clock against changes in cellular metabolism. What effect does temperature usually have on chemical reactions? McClung Plant Cell 18, 792 (2006) Modeling Cell Fate
Essential elements of biological clocks Our biological clocks contain 3 essential elements: (1) a central oscillator that keeps time; (2) the ability to sense time cues in the environment and to reset the clock as the seasons change; and (3) a series of outputs tied to distinct phases of the oscillator that regulate activity and physiology. Gallego et al. Nat.Rev.Mol.Cell.Biol. 8, 140 (2007) Modeling Cell Fate 27
Parameters of Circadian clocks Period : time to complete one cycle. Amplitude of the rhythm : one-half the peak-to-trough distance. Phase : time of day for any given event. E.g. if the peak in a rhythm occurred at dawn, the phase of the peak would be defined as 0 h. Phase is often defined in zeitgeber time (ZT). Zeitgeber is German for „time giver“, and any stimulus that imparts time information to the clock is a zeitgeber. The onset of light is a powerful zeitgeber, and dawn is defined as ZT0. McClung Plant Cell 18, 792 (2006) Modeling Cell Fate
Suprachiasmatic nucleus (SCN) In mammals, the central clock resides in the suprachiasmatic nucleus (SCN), a small region of the brain that contains ca. 20,000 neurons. The SCN produces a rhythmic output that consists of a multitude of neural and hormonal signals that influence sleep and activity. Most importantly, the SCN signals set the peripheral clocks present throughout the body. The SCN clock is reset by external light, which is sensed by the ganglion cells of the retina. Gallego et al. Nat.Rev.Mol.Cell.Biol. 8, 140 (2007) Modeling Cell Fate 29
Autonomous oscillators everywhere Remarkably, autonomous circadian oscillators are also present in all tissues of the body, where they are synchronized by unidentified signals to regulate, in a tissue-specific manner, transcriptional activity throughout the day. Paolo Sassone-Corsi, UC Irvine Eckel-Mahan & Sassone-Corsi, Nat. Struct. Mol. Biol. 16, 462 (2009) Modeling Cell Fate 30
Basic molecular elements of the mammalian clock (a) 2 TFs CLOCK and BMAL1 heterodimerize. (b) BMA1:CLOCK binds to the E-boxes in the promoters of the PER and CRY genes, as well as in the clock-controlled genes, activating their transcription. (c) The PER and CRY proteins dimerize, enter the nucleus and inhibit CLOCK-BMAL1–activated transcription. This is the minimal scheme for the mammalian clock. It requires several interconnecting transcriptional, translational and post-translational loops to achieve gene expression with circadian periodicity Sancar, Nat. Struct. Mol. Biol. 15, 23 (2008) Modeling Cell Fate 31
Full (?) circuit of circadian rhythms in mammals PER: period CRY: cryptochrome CK1: casein kinase Rev-erb, ROR: retinoic acid- related orphan nuclear receptors Cdg: clock-controlled gene(s) Ko & Takahashi Hum Mol Genet 15, R271 (2006) Modeling Cell Fate
Circadian clocks in Arabidopsis thaliana Plants were the first organisms for which the observation of a circadian rhythm was published (de Mairan, 1729). The molecular study of plant clocks began in 1985 with the observation that the mRNA abundance of the light-harvesting chlorophyll a/b-binding protein genes (LHCB) of peas oscillated with a circadian rhythm. Salomé et al. J. Biol. Rhythms 19, 425 (2004) Modeling Cell Fate
Key players in Arabidopsis thaliana LHCB transcription is induced by light and shows a circadian pattern of expression with a peak in the middle of the subjective day. The red-light photoreceptors, the phytochromes (PHY), mediate the light induction of LHCB through a motif in the LHCB promoter. Comment: LHs absorb maximally at 850 nm (red light). Minimal promoter fragments necessary and sufficient for light and circadian regulation of LHCB were identified. Tobin’s group identified a protein with affinity to this promoter fragment. This TF was named CCA1 for CIRCADIAN CLOCK ASSOCIATED 1. LATE ELONGATED HYPOCOTYL (LHY) is another gene encoding a protein closely related to CCA1. Salomé et al. J. Biol. Rhythms 19, 425 (2004) Modeling Cell Fate
Model of the Arabidopsis thaliana oscillator Light perceived by the PHYs and CRYs induces the expression of 2 transcription factors, CCA1and LHY. CCA1 and LHY mRNA abundance peaks shortly after dawn (dt. Morgendämmerung). CCA1 requires phosphorylation by CK2 prior to binding to DNA. Salomé et al. J. Biol. Rhythms 19, 425 (2004) Modeling Cell Fate
Model of the Arabidopsis thaliana oscillator One known target of the repressive activity of CCA1 and LHY is TOC1 (Timing of Cab Expression 1). Therefore, TOC1 mRNA abundance peaks around dusk, following the turnover of CCA1 and LHY proteins. TOC1 then feeds back onto CCA1 and LHY and induces their expression for the next cycle. Salomé et al. J. Biol. Rhythms 19, 425 (2004) Modeling Cell Fate 36
Model of the Arabidopsis thaliana oscillator TOC1 degradation is mediated by the F-box protein ZTL (Zeitlupe = slow motion), whose activity is negatively regulated by light. CCA1 and LHY also negatively regulate their own promoters, possibly directly but possibly indirectly via TOC1. Salomé et al. J. Biol. Rhythms 19, 425 (2004) Modeling Cell Fate 37
Detect unknown control mechanisms:Probe gene expression by microarrays Harmer et al. used oligonucleotide-based arrays to determine steady-state mRNA levels in Arabidopsis at 4-hour intervals during the subjective day and night. identify temporal patterns of gene expression in Arabidopsis plants under constant light conditions using GeneChip arrays representing about 8200 different genes. Score all genes whether their expression is correlated with a cosine test wave with a period between 20 and 28 hours (probable correlation > 95%) consider those genes as circadian-regulated. 453 genes (6% of the genes on the chip) were classified as cycling. Harmer et al. Science 290, 2110 (2000) Modeling Cell Fate
Photosynthesis genes peak near the middle of the day Results after normalization of peak maximum. • LHCA genes are in blue;. LHCB genes are in pink;. (B) Photosystem I genes are in red;. Photosystem II genes are in green;. (C) Model for function of photosynthesis gene products in photosystems II (left) and I (right). Colors of proteins match colors of corresponding gene traces. Harmer et al. Science 290, 2110 (2000) Modeling Cell Fate
Synchronized production of photoprotective pigments „Phenolic sunscreen“ Substances absorb light in the visible and UV range. Harmer et al. Science 290, 2110 (2000) Modeling Cell Fate
Circadian regulation of sugar metabolism Genes encoding starch-mobilizing enzymes peak during the subjective night because plants store starch in chloroplast for use during the night when the plant cannot do photosynthesis. (A) Cycling genes encode a putative starch kinase that is related to potato R1 protein (dark blue); a β-amylase (gold); fructose-bisphosphate aldolase, (red); a putative sugar transporter (light blue); and a sucrose-phosphate synthase homolog (green). (B) Model for the enzymatic functions of these gene products in the mobilization of starch. Colored arrows indicate the function of the corresponding gene indicated in (A). The chloroplast is bounded by a green box and the cytoplasm by a black box. Harmer et al. Science 290, 2110 (2000) Modeling Cell Fate
Chilling resistance Chilling resistance is an important trait in plants. A number of enzymes involved in lipid modification, including two desaturases, were found to be under clock regulation and peaked near subjective dusk. This is consistent with previously observed rhythms in membrane lipid desaturation levels that correlate with increased resistance to cold treatments during the subjective night. Gallego et al. Nat.Rev.Mol.Cell.Biol. 8, 140 (2007) Modeling Cell Fate
Genes implicated in cell elongation are circadian-regulated (B) Proposed mode of action of the products of these clock-controlled genes in cell wall remodeling. The rigid plant cell wall normally prevents cell expansion, but a simultaneous loosening of cell wall components, uptake of water, and synthesis of cell wall components seems allowed. (A) Genes encoding the auxin efflux carriers PIN3 and PIN7 (red), a putative expansin (green), a putative polygalacturonase (light blue), and aquaporin d-TIP (dark blue) all peak toward the end of the subjective day. Auxins are phytohormones – they regulate cell extension. 3 enzymes implicated in cell wall synthesis (all in gold) peak toward the end of the subjective night. Harmer et al. Science 290, 2110 (2000) Modeling Cell Fate
Master regulator sequence of circadian-regulated genes? Check genomic DNA regions upstream of cycling genes for overrepresented promoter elements absolutely conserved motif, AAAATATCT “evening element,” that occurs 46 times in the promoters of 31 cycling genes. All genes demonstrated impressive coregulation. All but one peak toward the end of the subjective day. Mutation of the conserved AAAATATCT, but not a closely related motif, greatly reduced the ability of a promoter to confer circadian rhythmicity on a luciferase reporter gene in plants. Harmer et al. Science 290, 2110 (2000) Modeling Cell Fate
Summary Most organisms enhance fitness by coordinating their development with daily environmental changes through molecular timekeepers known as circadian clocks. Clocks are generated by a transcription-translation negative feedback loop with a crucial delay between stimulus and response. This system of multiple connected loops increases the clock’s robustness and provides numerous points of input and output to the clock. Many metabolic pathways are regulated by circadian clocks in plants and animals. Kay & Schroeder Science 318, 1730 (2007) Modeling Cell Fate
Summary Cells need to tightly control their exact position in the cell cycle and in development. Control during cell cycle: checkpoints + Cdk / cyclin system Control during development: different chromatin states / epigenetics Cancerogenesis is determined by random apperance of driver mutations plus sofar poorly understood epigenetic changes. Cellular differentiation and cancerogenesis involve similar players of the epigenetic machinery. Next week: discuss paper http://www.pnas.org/content/111/45/16219.abstract Modeling Cell Fate