Download
1 / 1
10 likes | 172 Views
Risk Ranking Tool for Prioritizing Commodity and Pathogen Combinations for Risk Assessment of Fresh Produce. Maren Anderson, PhD 1 ; Lee-Ann Jaykus, PhD 2 ; Steve Beaulieu 1 , and Sherri Dennis, PhD 3

E N D
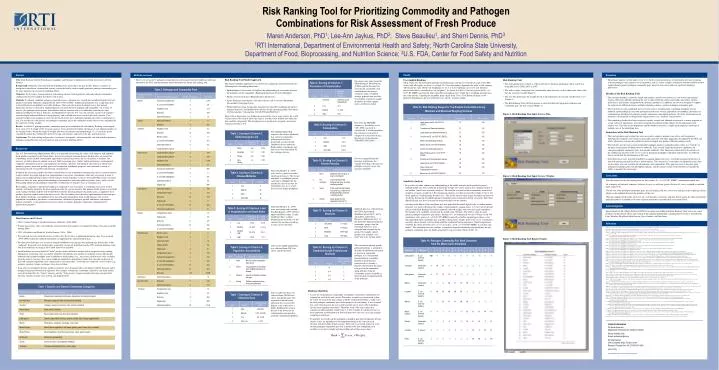
Risk Ranking Tool for Prioritizing Commodity and PathogenCombinations for Risk Assessment of Fresh Produce Maren Anderson, PhD1; Lee-Ann Jaykus, PhD2; Steve Beaulieu1, and Sherri Dennis, PhD3 1RTI International, Department of Environmental Health and Safety; 2North Carolina State University, Department of Food, Bioprocessing, and Nutrition Science; 3U.S. FDA, Center for Food Safety and Nutrition Results Un-weighted Rankings Table 13 presents the top-ranked pathogen-commodity pairs and their associated risk rank scores (RR Score) with all weights set at low (1) or high (5). Given the ranking algorithm, the order of risk rankings will remain the same whether all weightings are set at 1 or all weightings are set at 5 and, therefore, these results may be considered as “un-weighted”. As shown in Table 13, the leafy greens and E. coli O157:H7 (EHEC) pair had the largest possible risk ranking score. Under these weighting specifications, the scores for the 51 pathogen-commodity pairs ranged from 13 to 155. Different rankings can be produced depending on the user preferences for specific criterion weights. • Methods (continued) • There were a total of 51 pathogen-commodity pairs determined from the foodborne outbreaks reported to the CDC and the literature that formed the basis for the risk ranking tool: Abstract Title: Risk Ranking Tool for Prioritizing Commodity and Pathogen Combinations for Risk Assessment of Fresh Produce Background: Outbreaks associated with fresh produce have increased in the past decade. There is currently no transparent, data-driven, customizable ranking system that can be used to rapidly prioritize pathogen-commodity pairs for more rigorous risk assessment modeling efforts. Objective: To develop a semi-quantitative risk ranking software tool to prioritize and rank pathogen-commodity combinations based on explicit data-driven risk criteria. Methods: To identify candidate pathogen-commodity pairs, a database was created that included all reports of fresh produce-associated outbreaks compiled by the CDC (1996 to 2006). Additional information was sought from peer-reviewed literature and publicly accessible databases. Nine risk criteria were developed across four primary dimensions of risk: (i) strength of epidemiological association between pathogen and commodity; (ii) severity of disease; (iii) pathogen characteristics that influence disease outcome; and (iv) commodity characteristics that influence pathogen prevalence, behavior, and likelihood of exposure. For each risk criterion, narrative descriptions were developed and quantified for scoring purposes, and available data were used to score each criterion. User-specified weights were assigned to each criterion based on the user’s judgment regarding the relative contribution to risk. The overall risk score for any one pathogen-commodity pair is the summation of the criteria scores multiplied by the respective criteria weights. Results: A total of 51 pathogen-produce commodity pairs were included in the risk ranking. Ranking scores ranged from a low of 13 to a high of 155. Scenario analyses were performed to explore the impact of user-defined weights on the ranking results. Within the range of weights that were considered, enterohemorrhagic E. coli and leafy greens consistently ranked first, followed by Salmonella spp. and tomatoes and Salmonella spp. and leafy greens. Conclusions: The risk ranking tool provides a systematic, transparent, and customizable tool with which to prioritize pathogen-commodity pairs for more rigorous risk assessment modeling efforts. • Discussion • The primary purposes of this project were to (1) build a relational database of information relevant to ranking risks for pathogens and categories of fresh produce, and (2) create a simple, transparent tool that could be used to rapidly identify priority pathogen-commodity pairs based on risk criteria and user-specified weighting preferences. Risk Ranking Tool Model Approach The general modeling approach was a relative risk ranking that took into account the following four risk ranking dimensions: • Risk Ranking Tool • The risk ranking tool was built as a Microsoft Access database application, which can be run using MS Access 2000, 2003, or 2007. • The tool is simple, transparent and customizable where the user can first choose the value of the bins for each risk variable (Figure 1). • The user then determines the weights based on the importance of each risk variable from 1 to 5 (Figure 2). • The Risk Ranking Tool will then generate a report detailing the top priority pathogen and commodity pairs for that scenario (Figure 3). Prevalence data values from the Microbiological Data Program (USDA) and the literature for each specific commodity were combined into the general categories using a weighted average approach that used the total number of positive samples divided by the total samples across all relevant studies. • Epidemiological Association: Strength of the epidemiological association between the pathogen and the commodity (Epidemiological Link, Disease Multiplier) • Health: Severity of disease (Hospitalization, Death rates) • Agent: Pathogen characteristics that affect disease risk or severity (Population Susceptibility, Infectious Dose) • Production/Processing: Commodity characteristics that affect pathogen prevalence, pathogen behavior, and likelihood of exposure by the consuming public (Prevalence of Contamination, Consumption, Growth Potential/Shelf Life) • Benefits of the Risk Ranking Tool • The conceptual model is relatively simple and intuitive, and the user interface is easy to use with minimal training. The tool is flexible, allowing the user to choose both the criteria and weights that reflect specific preferences, and includes straightforward reporting capabilities. In addition, the tool was designed to support the inclusion of additional criteria, multiple weighting schemes, and new pathogen-commodity pairs. • The tool relies on well-established, peer-reviewed sources of information, combining foodborne disease outbreak (epidemiological) data with information on disease severity, population susceptibility, prevalence of contamination, likelihood of pathogen growth, and human consumption patterns. All of the information in the database is documented according to the original source (e.g., database, journal article). • The underlying database has been extensively quality assured and, although it represents a current snapshot of a wide variety of information, it has been designed to facilitate periodic updates of the information with relative ease. The data are not proprietary and the database structure is simple and transparent, allowing for multiple uses of the underlying data. • Limitations of the Risk Ranking Tool • The food categories and scoring bins were necessarily simple to promote ease-of-use and transparency. Although the categories and scoring are generally consistent with other approaches developed by the FDA and others, alternative schemes that could have been developed may produce different ranking results. • The tool does not take into account all possible pathogen-produce commodity pairs, rather, it is “trained” on the basis of recognized foodborne disease outbreaks. This severely limits the predictive capabilities for emerging pathogen-commodity pairs and sporadic outbreaks. This limitation is illustrated by the absence of the combination of Salmonella enterica serovar Saintpaul and peppers (Jalapeño and Serrano), an outbreak that occurred after the development of this tool. • Data deficiencies were generally handled by assigning higher risk scores, essentially equating the absence of data with greater potential for adverse health impacts. This “protective” convention was adopted because data on all criteria were not available for all pathogens and commodities. This approach tends to bias data poor pathogen-commodity pairs towards higher rankings, and the current version of the tool does not include the ability to quantify this uncertainty. Figure 1. Risk Ranking Tool Input Screen: Bins Each of these dimensions was further characterized by two or more criteria, for a total of nine criteria. For each of these nine criteria, four bins were defined into which the data could be categorized. The descriptions for each bin were assigned a numerical, ordinal score from 1 to 4. Data from the NHANES database (3 day dietary recall, CDC, 2008) was used to calculate the % of the population that consumes each general category on a daily basis using the first day of the diet data (NHANES 2003-2004). The epidemiological link expresses the relative likelihood that a general commodity-pathogen pair has been historically associated with foodborne disease outbreaks. Both number of outbreaks and total cases were considered for this ranking criterion. Background The U.S. Food and Drug Administration (FDA) is responsible for ensuring the safety of all domestic and imported fresh produce consumed in the United States. Sources of pathogen contamination in fresh produce are varied, but contributing factors include contaminated agricultural or processing waters, the use of manure as fertilizer, the presence of wild or domestic animals in or near fields or packing areas, worker health and hygiene, environmental conditions, production activities, and equipment and facility sanitation. Consequently, the manner in which fresh produce is grown, harvested, packed, processed, transported, distributed, prepared, and consumed is crucial to minimizing the risk of microbial and chemical contamination. In light of the increasing number of produce-related illnesses due to pathogen contamination, there is renewed interest in interventions that might help prevent contamination or inactivate contaminants when they are present in food. A logical step in implementing targeted control strategies for fresh produce is the use of microbiological risk assessment. However, there are many potential microbiological contaminants and many different produce items, and as a result, determining which specific pathogen-commodity combinations on which to focus is a daunting task. Risk ranking, sometimes called hazard ranking or comparative risk assessment, is a technique that can be used to identify, and thereby prioritize, the most significant risks for a given situation. The purpose of this project was to build a risk ranking tool that could be used by the FDA to identify priority pathogen-commodity pairs, as applied to fresh produce, based on explicit criteria that relate to risk. The risk ranking tool is based on epidemiological data from past fresh produce outbreaks, and combines those data with other information about health outcomes and severity, population susceptibility, prevalence of contamination, likelihood of pathogen growth, and human consumption patterns to produce a semi-quantitative means by which to compare pathogen-commodity combinations for prioritization purposes. Data was compiled from the literature to determine the strength of evidence that any one pathogen can grow in any one general commodity. Data from Mead et al. (1999) were used as a proxy for under-reporting of diseases. The disease multiplier is a pathogen-specific value that is multiplied by the number of cases to account for unreported cases. Less severe diseases have higher multipliers. • Conclusions • For all iterations of the risk ranking tool, the leafy greens–E. coli O157:H7 (EHEC) combination ranked first. • In a majority of iterations, tomatoes–Salmonella enterica and leafy greens–Salmonella enterica ranked second and third, respectively. • For the rest of the pathogen-commodity pairs, the risk ranking tool was sensitive to changes in the weighting scheme, which can be modified based on the priorities of the user. • The risk ranking tool provides an easy to use, customizable, systematic, and data-driven means by which to prioritize pathogen-produce commodities for more rigorous quantitative microbial risk assessment efforts. Figure 2. Risk Ranking Tool Input Screen: Weights • Sensitivity Analysis • In an effort to further enhance our understanding of the model function and its predictive power, multiple model runs were conducted in which the weights for various criteria were changed relative to one another (similar to a sensitivity analysis). The baseline scenario for these simulations consisted of all inputs assigned a weight of 2. For comparison purposes, we then increased the weight of one or two of the inputs to 5 while keeping all others at 2. The results showed some degree of model sensitivity to all criteria, but the top 10 ranked pathogen-commodity pairs remained relatively consistent, albeit their individual rank may have increased or decreased relative to one another. • An abbreviated Monte Carlo simulation was also applied to the model. Specifically, a random number generator was used to determine the weights (ordinal numbers ranging from 1 to 5) for each of the nine criteria of the Risk Ranking Tool; these randomly selected weights were used in a single simulation. The weights were randomly selected and the model rerun 100 times. The relative ranks for each specific pathogen-commodity pair (from 1 through 11+) are summarized over the 100 runs. In all 100 simulations, leafy greens–E. coli O157:H7 (EHEC) ranked first, further supporting its choice as the top-ranked pathogen-commodity pair, regardless of parameter weight. Salmonella enterica in tomatoes and leafy greens formed a cluster which could be considered 2nd in importance. Third in importance would be the cluster of Salmonella enterica in melons, and E. coli O157:H7 (EHEC) in crucifers and melons. This simulation exercise confirms a consistent output for identifying and prioritizing the top pathogen-commodity pairs for further quantitative risk assessment efforts (Table 14). Acknowledgments Data from Mead et al. (1999) were used along with available FoodNet Reports (1997–2004) to update the Mead values. A mild foodborne illness without hospitalization or death is of less concern that an illness resulting in more severe outcomes. Shelf life data was collected from the USDA Agricultural Handbook 66 and the U. of CA Agriculture and Natural Resources Publication 3311. If the shelf lives differed within the commodity groups, then the individual shelf lives were compiled and averaged for the group. For example, mixed produce was assigned “very short” due to its variable nature. Special thanks to Ms. Megan Tulloch of RTI for designing and building the Risk Ranking Tool, and to our expert panelists for their timely advice and council on the ranking methodology, including Trevor Suslow, Scott Brooks, Larry Beuchat, Meg Barth, Bob Gravani, Dave Gombas, and Jim Gorny. • Methods • Data Sources and Criteria • CDC’s Annual Listing of Foodborne Disease Outbreaks (1996-2006) • Primary data source. Only used outbreaks associated with fresh produce of confirmed etiology. Data only available through 2006. • CDC’s Morbidity and Mortality Weekly Reports (1996 – 2006) • We reviewed all issues of the Morbidity and Mortality Weekly Report published during the same 10-year period (1996–2006) to identify outbreak information to supplement the annual outbreak data. • Peer Reviewed Literature was reviewed using the PubMed search engine (www.pubmed.org) with the key words “outbreak” along with each fresh produce commodity of concern identified from the CDC outbreak database. Only data from outbreaks occurring in the United States were included. • Initial inclusion criteria included all “fresh” produce items, defined as produce that is not preserved by canning, dehydration, or freezing. This was further refined by the addition of a number of exclusion criteria. Specifically, outbreaks that included multiple foods in addition to fresh produce (e.g., tuna salad, chicken tacos) were excluded from the analysis because clear source attribution could not be determined. Salads that consisted exclusively of fruit and vegetable ingredients were categorized as “mixed produce.” Items that are commonly served cooked (e.g., potatoes, squashes, turnips, rutabagas) were also excluded. • In an effort to consolidate the data, produce categories were designated after consultation with the literature and in keeping with general botanical designations. For example, watermelon, cantaloupe, honeydew, and musk melons were all included into the “melon” category, and the “leafy greens” category includes the lettuce (unspecified), mesclun, spinach, romaine, leaf, iceberg, and bagged lettuce. References Arthur, L., S. Jones, M. Fabri, and J. Odumeru. 2007. Microbial survey of selected ontario-grown fresh fruits and vegetables. Journal of Food Protection 70(12):2864–2867. Beuchat, L.R. 1996. Pathogenic microorganisms associated with fresh produce. Journal of Food Protection 59(2):204–216. Blaser, M.J., and L.S. Newman 1982. A review of human salmonellosis: I. Infective dose. Reviews of Infectious Diseases 4(6):1096–1106. Castillo, A., I. Mercado, L.M. Lucia, Y. Martínez-Ruiz, J. Ponce de León, E.A. Murano, and G.R. Acuff. 2004. Salmonella contamination during production of cantaloupe: A binational study. Journal of Food Protection 67(4):713–720. CDC (U.S. Centers for Disease Control and Prevention). 1996–2006. Outbreak Surveillance Data:Annual Listing of Foodborne Disease Outbreaks, United States. Available at http://www.cdc.gov/foodborneoutbreaks/outbreak_data.htm. CDC (U.S. Centers for Disease Control and Prevention). 2008a. Morbidity and Mortality Weekly Report. Available at http://www.cdc.gov/mmwr/. Accessed February/March 2008. CDC (U.S. Centers for Disease Control and Prevention). 2008b. Campylobacter Fact Sheet. Division of Foodborne, Bacterial and Mycotic Diseases. Available at http://www.cdc.gov/nczved/dfbmd/disease_listing/campylobacter_gi.html CDC (U.S. Centers for Disease Control and Prevention). 2008c. Escherichia coliFact Sheet. Division of Foodborne, Bacterial and Mycotic Diseases. Available at http://www.cdc.gov/nczved/dfbmd/disease_listing/stec_gi.html CDC (U.S. Centers for Disease Control and Prevention). 2008d. Salmonellosis Fact Sheet. Division of Foodborne, Bacterial and Mycotic Diseases. Available at http://www.cdc.gov/nczved/dfbmd/disease_listing/salmonellosis_gi.html CDC (U.S. Centers for Disease Control and Prevention). 2008e. Shigellosis Fact Sheet. Division of Foodborne, Bacterial and Mycotic Diseases. Available at http://www.cdc.gov/nczved/dfbmd/disease_listing/shigellosis_gi.html CDC (U.S. Centers for Disease Control and Prevention). 2008f. Cryptosporidiosis Fact Sheet. Department of Health and Human Services. Available at http://www.cdc.gov/crypto/epi.html. CDC (U.S. Centers for Disease Control and Prevention). 2008g. Giardiasis Fact Sheet. Division of Parasitic Diseases. Available at http://www.cdc.gov/ncidod/dpd/parasites/giardiasis/factsht_giardia.htm. CDC (U.S. Centers for Disease Control and Prevention). 2008h. Cyclosporiasis Fact Sheet. Division of Parasitic Diseases. Available at http://www.cdc.gov/ncidod/dpd/parasites/cyclospora/factsht_cyclospora.htm CDC (U.S. Centers for Disease Control and Prevention). 2008i. Hepatitis A Virus Fact Sheet. Department of Health and Human Services. Available at http://www.cdc.gov/hepatitis/index.htm. CDC (U.S. Centers for Disease Control and Prevention). 2008j. Norovirus Fact Sheet. Department of Viral Diseases. Available at http://www.cdc.gov/ncidod/dvrd/revb/gastro/norovirus-factsheet.htm. CDC (U.S. Centers for Disease Control and Prevention). 2008k. National Health and Nutrition Examination Survey (NHANES) database. Available at http://www.cdc.gov/nchs/nhanes.htm, Accessed February, 2008. Duffy, E.A., L.M. Lucia, J.M. Kells, A. Castillo, S.D. Pillai, and G.R. Acuff. 2005. Concentrations of Escherichia coli and genetic diversity and antibiotic resistance profiling of Salmonella isolated from irrigation water, packing shed equipment, and fresh produce in Texas. Journal of Food Protection 68(1):70–79. Endley, S., L. Lu, E. Vega, M.E. Hume, and S.D. Pillai. 2003. Male-specific coliphages as an additional fecal contamination indicator for screening fresh carrots. Journal of Food Protection 66(1):88–93. Gerba, C.P., J.B. Rose, and C.N. Haas. 1996. Sensitive populations: who is at the greatest risk? International Journal of Food Microbiology 30(1-2):113-123. Havelaar, A., and Melse, J.M. 2003. Quantifying Public Health Risk in the WHO Guidelines for Drinking-Water Quality: A Burden of Disease Approach.Rijkinstituut voor Volskgezondheid en Milieu (RIVM), Bilthoven, Netherlands. RIVM Report 734301022 Hora, R., K. Warriner, B.J. Shelp, and M.W. Griffiths. 2005. Internalization of Escherichia coli O157:H7 following biological and mechanical disruption of growing spinach plants. Journal of Food Protection 68(12):2510–2518. Johnston, L.M., L.-A. Jaykus, D. Moll, M.C. Martinez, J. Anciso, B. Mora, and C.L. Moe. 2005. A field study of the microbiological quality of fresh produce. Journal of Food Protection 68(9):1840–1847. Johnston, L.M., L.-A. Jaykus, D. Moll, M.C. Martinez, J. Anciso, B. Mora, and C.L. Moe. 2006. A field study of the microbiological quality of fresh produce. International Journal of Food Microbiology 112:83–95. Kader, A.A. 2002 Postharvest Technology of Horticultural Crops. Third Edition. University of California Agriculture and Natural Resources Publication #3311. Kothary, M.H. and U.S. Babu. 2001. Infective dose of foodborne pathogens in volunteers: a review. Journal of Food Protection 21(1):49–73. Little, C., D. Roberts, E. Youngs, and J. deLouvois. 1999. Microbiological quality of retail imported unprepared whole lettuces: a PHLS Food Working Group Study. Public Health Laboratory Service. Journal of Food Protection 62(4):325–328. Mead, P.S., L. Slutsker, V. Dietz, L.F. McCaig, J.S. Bresee, C. Shapiro, P.M. Griffin, and R.V. Tauxe. 1999. Food-related illness and death in the United States. Emerging Infectious Diseases 5(5):607–625. Mukherjee, A., D. Speh, E. Dyck, and F. Diaz-Gonzalez. 2004. Preharvest evaluation of coliforms, Escherichia coli, Salmonella, and Escherichia coli O157:H7 in organic and conventional produce grown by Minnesota farmers. Journal of Food Protection 67(5):894–900. Mukherjee, A., D. Speh, A.T. Jones, K.M. Buesing, and F. Diaz-Gonzalez. 2006. Longitudinal microbiological survey of fresh produce grown by farmers in the upper midwest. Journal of Food Protection 69(8):1928–1936. Orozco, L., L. Rico-Romero, and E.F. Escartin. 2008. Microbiological profile of greenhouses in a farm producing hydroponic tomatoes. Journal of Food Protection 71(1):60–65. Park, C.E., and G.W. Sanders. 1992. Occurrence of thermotolerant campylobacters in fresh vegetables sold at farmers’ outdoor markets and supermarkets. Canadian Journal of Microbiology 38(4):313–316. Phillips, C.A. and M.A. Harrison. 2005. Comparison of the microflora on organically and conventionally grown spring mix from a california processor. Journal of Food Protection 68(6):1143–1146. Samadpour, M., M.W. Barbour, T. Nguyen, T.M. Cao, F. Buck, G.A. Depavia, E. Mazengia, P. Yang, D. Alfi, M. Lopes, and J.D. Stopforth. 2006. Incidence of enterohemorrhagic Escherichia coli, Escherichia coli O157, Salmonella, and Listeria monocytogenes in retail fresh ground beef, sprouts, and mushrooms. Journal of Food Protection 69(2):441–443. Thunberg, R.L., T.T. Tran, R.W. Bennett, R.N. Matthews, and N. Belay. 2002. Microbial evaluation of selected fresh produce obtained at retail markets. Journal of Food Protection 65(4):677–682. USDA (U.S. Department of Agriculture). 2002–2007. Microbiological Data Program: Program Reports. Agricultural Marketing Service. Available at http://www.ams.usda.gov/mdp. USDA (U.S. Department of Agriculture). 2004. The Commercial Storage of Fruits, Vegetables, and Florist and Nursery Stocks. Agriculture Handbook 66. Agricultural Research Service. Available at http://www.ba.ars.usda.gov/hb66/. April. U.S. FDA (Food and Drug Administration). 1998. Guide to Minimize Microbial Food Safety Hazards for Fresh Fruits and Vegetables. Center for Food Safety and Applied Nutrition. October 26. Available at http://www.foodsafety.gov/~dms/prodguid.html. U.S. FDA (Food and Drug Administration). 2001. Outbreaks Associated with Fresh and Fresh-Cut Produce: Incidence, Growth, and Survival of Pathogens in Fresh and Fresh-Cut Produce. Chapter IV in Analysis and Evaluation of Preventive Control Measures for the Control and Reduction/Elimination of Microbial Hazards on Fresh and Fresh-Cut Produce. Center for Food Safety and Applied Nutrition. September 30. Available at http://vm.cfsan.fda.gov/~comm/ift3-4a.html. U.S. FDA (Food and Drug Administration). 2001. FDA Survey of Imported Fresh Produce. Available at http://www.cfsan.fda.gov/~dms/prodsur6.html. Accessed February/March 2008. U.S. FDA (Food and Drug Administration). 2005. Food Code. Center for Food Safety and Applied Nutrition.Available at http://www.cfsan.fda.gov/~dms/fc05-toc.html. U.S. FDA (Food and Drug Administration). 2006. Guide to Minimize Microbial Food Safety Hazards of Fresh-cut Fruits and Vegetables. Center for Food Safety and Applied Nutrition.February. Available at http://www.cfsan.fda.gov/~dms/prodgui4.html. U.S. FDA (Food and Drug Administration). 2008. Bacillus cereus and other Bacillus spp. Fact Sheet. Center for Food Safety and Nutrition. Available at http://www.cfsan.gov/~mow/chap12.htm. Valentin-Bon, I., A. Jacobson, S.R. Monday, and P.C.H. Feng. 2008. Microbiological quality of bagged cut spinach and lettuce mixes. Applied Environmental Microbiology 74(4):1240–1242. Figure 3. Risk Ranking Tool Report Output The criterion designated growth potential/shelf-life is intended to describe the likelihood and extent of growth of a particular pathogen in a contaminated general produce commodity, keeping in mind that this characteristic is actually a function of how likely the agent is to grow in the commodity, along with how long the commodity remains available in the food chain to support growth of the pathogen. Data on susceptible populations was collected from CDC fact sheets and the literature. • Ranking Algorithm • A score for each pathogen, commodity, or pathogen-commodity combination was assigned for each of the nine criteria. Thereafter, a model was constructed so that the scores for each of the nine criteria could be combined to produce a single score for each pathogen-commodity pair for the purposes of risk ranking. It was assumed that, more often than not, the user would consider one or more of the individual criteria more important than others. Therefore, each of the nine criteria was assigned an ordinal number weight from 1–5. For example, if a death outcome is a more important consideration than low infectious dose, the user can assign a higher weighting to death rate. • To generate an overall rank per pathogen-commodity pair that incorporates all nine criteria scores, an algorithm was developed that balances the score for each criterion with the weight of that criterion. The result is an overall numerical score for each pathogen-commodity pair that is produced by first multiplying each variable’s score by its weight and then adding each of these nine values: Data on infectious dose was collected from CFSAN fact sheets and the literature. The organisms with the lowest infectious dose received the highest score as they have a higher likelihood of causing disease at the low levels of contamination anticipated in naturally-contaminated produce. Contact Information Dr. Maren AndersonDepartment of Environment, Health and Safety Phone: 919.485.2740E-mail: andersonm@rti.org RTI International3040 Cornwallis Road, PO Box 12194Research Triangle Park, NC 27709-2194 USA www.rti.org RTI International is a trade name of Research Triangle Institute.