Download
1 / 24
240 likes | 378 Views
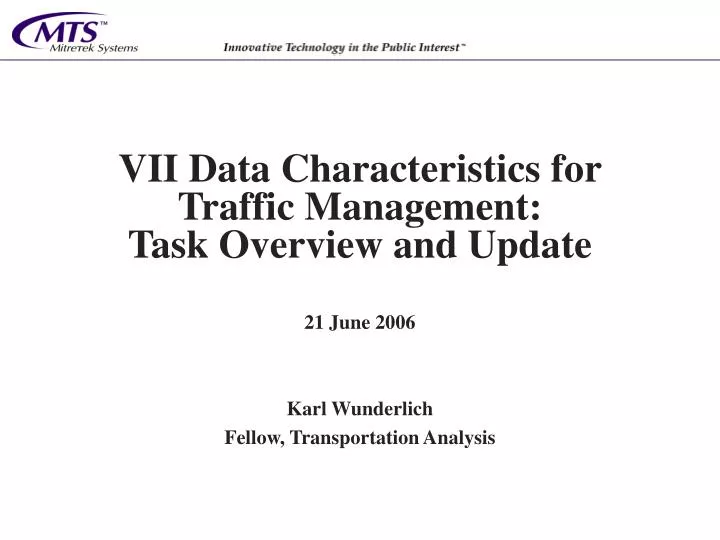
VII Data Characteristics for Traffic Management: Task Overview and Update. 21 June 2006 Karl Wunderlich Fellow, Transportation Analysis. Scope. Examine capability of VII probe data to support (specifically): Signal control Ramp metering Traveler information

E N D
VII Data Characteristics for Traffic Management: Task Overview and Update 21 June 2006 Karl Wunderlich Fellow, Transportation Analysis
Scope • Examine capability of VII probe data to support (specifically): • Signal control • Ramp metering • Traveler information • This capability must be examined with respect to key variables: • Facility type (arterial/freeway/rural) and geometry • Congestion levels and road/weather conditions • Market penetration • VII probe message management • In-vehicle • At the roadside and in backhaul communication • Near-term analytical emphasis is on the support of Day 1 applications • For example, off-line periodic signal retiming versus “real-time” adaptive signal control
Objectives • Identify likely content of collected VII probe messages passed to traffic managers or traveler information service providers under realistic conditions • Develop (where possible) algorithms that will estimate key measures from the collected probe data, for example: • Vehicle volumes by lane and turning movements • Travel times and intersection delays • Estimate the accuracy of these algorithms with respect to the key variables from previous slide (e.g., market penetration) • Provide USDOT with an understanding of key tradeoffs along a spectrum of issues/conditions (e.g., privacy)
Mitretek Systems Team Michael McGurrin Karl Wunderlich Meenakshy Vasudevan Emily Parkany Phil Tarnoff, U-Md. Staffing and Coordination USDOT Task Manager Brian Cronin Key VII-Related Activities Use Case Development (BAH) VII Data Elements (PB)
Approach • Data needs assessment • Define the data required by traffic management and traveler information applications • Qualitative assessment of data produced by VII to meet these identified needs • Analytical assessment of VII probe data • Develop an analytical tool that takes… • Vehicle trajectory data • Specific probe message management strategy • Assumed RSE deployment … and produces the associated VII probe data content • Trajectory data will come from a variety of sources: • Observed (e.g., NGSIM or floating car data) • Simulated (e.g., from a traffic simulation) • Develop algorithms to process this probe data into measures of interest (e.g., link travel time)
VII Data CharacteristicsTask Planned Expended Funding Completed Coordination Meetings Planned (+ internal draft) Remaining Funding Completed Completed Brian/Karl 1 FTE Width indicates relative Mitretek LOE Full Team Deliverables Bi-Weekly Status Updates (Scheduled) 4/1 11/1 7/1 3/1 10/1 6/1 9/1 1/1 5/1 8/1 12/1 Coordination/ Progress Briefings Briefing 2 Briefing 3 Briefing 1 Kickoff Data Needs White Paper Assess Needs Data Needs Assessment Prelim Matrix Initial Strategy Development Initial Strategies Acquire/Prep Trajectory Data revisions Data Characteristics WP (final) Observed Data Track write-up Preliminary Strategy Evaluation Draft WP Analytical Tool Development and Evaluation Build Trajectory Converter Derivation Algs. (I) Downselect Strategies (II) Downselect Strategies (I) Validate Sim Trajectories Tradeoff Analyses write-up Simulation Track Multi-RSE Strategy Evaluation Acquire Traffic Simulation and Test Networks Enhance Converter Der. Algs. (II) Day 1 Final Report (draft) 12 June 2006
Key Deliverables • Data Needs White Paper (completed) • Broad, qualitative assessment of Day 1 and later needs • Applications Preliminary Requirements Matrix (completed) • High-level assessment of the capability of VII data to meet the identified short- and long-term needs • Data Characteristics White Paper (1 September 2006) • Summary of findings, primarily from observed data analysis • Initial assessment of capability of VII probe data to support Day 1 applications • Draft Day 1 Final Report (1 January 2007) • Update and expansion of the September white paper • Results from the analysis of simulated trajectories • More comprehensive assessment of key tradeoffs
1 3 2 Extract Sample Depending on Market Penetration 4 Populate With Snapshots According to Message Handling Strategy Process Snapshots To Estimate Measures Queue Length Travel Time Other From Trajectories to Measures Vehicle Trajectories Position Time
Observed Data Sets, Floating Car:Strengths and Weaknesses Road Weather Management • Floating car trajectory data • Strengths: • Trajectories are long (30+ miles in some cases) • Arterial, freeway, rural road facilities • Light to heavy congestion conditions • Some “other data” collected that looks like VII data elements (e.g., weather or turn signal disposition) • Weaknesses: • Only one vehicle tracked • Ground truth measures can’t be directly observed for aggregate traffic flow – just one vehicle • Will be most valuable for looking at travel time derivation issues over longer links, potentially widely dispersed RSEs
Observed Data Sets: NGSIM • NGSIM data are high-resolution vehicle trajectory data • Processed video images from multiple high-angle cameras • Near 100% of all vehicle positions traced at 0.1 sec intervals • Detailed lane position and disposition to other vehicles • Two freeway data sets, one arterial data set • Strengths: 100% vehicle coverage • Weaknesses: Short coverage areas (under 1 km)
Simulated Vehicle Trajectories:Strengths and Weaknesses • Simulated trajectory data • Strengths: • Most facilities of interest can be modeled • 100% tracking of vehicles • Ground truth measures can be directly obtained • Congestion levels and other elements can be systematically adjusted • Weaknesses: • Validity of detailed trajectories under congestion is poorly understood • Time and effort to build and calibrate realistic networks • Will be most valuable when attempting to deal with incremental tradeoffs for key issues like market penetration and buffer size
Sample Trajectory Conversion:Columbus, Ohio: Route 33 and I-270 • Run Type : GPS (Floating Car) • Distance: 62.0 Miles • Travel Time: 93.8 Minutes • Average Speed: 39.6 mph • RSE Spacing : 2.3 miles between RSEs (on average) • Snapshots per Mile: 10.0 • Vehicle IDs (Transmit/Produced): 32 / 42 • Snapshots per ID (Transmit/Produced): 9.4/13.7 • Total number of Snapshots: 618 • Stop Snapshots: 23 • Start Snapshots: 13 • Periodic Snapshots: 582
Walk-Through of Default VII Probe Message Process • Location: • A congested segment on I-270 • What we will examine: • 50 Snapshots taken right after vehicle RSE interaction • Time • 3133 to 3448 seconds (5.25 minutes) • Distance: • 1.9 Miles
Time 3133-3244 (1.85 Min)0.69 Miles 43 secs (7 SS) Spd 20-28 48 Secs (1 Start) Spd 10.5 12 secs (4 SS) Spd 0-9 T 3196 (1 Stop) Periodic 11 Stop 1 Start 1 Capacity 13/30 Deleted Periodic 0 Stop 0 Start 0
Time 3244 – 3356 (1.87 mins)0.69 Miles 12 secs 4 SS Spd 12-19 29 secs 6 SS Spd 22-32 14 secs 2 SS Spd 43 20 secs 7 SS Spd 4-12 1 secs 1 SS Spd 19 T 3356 (1 Stop) Buffer is full 3.25 mins after the last vehicle RSE Interaction Periodic 27 Stop 2 Start 1 Capacity 30/30 Deleted Periodic 4 Stop 0 Start 0 Deleted from SS from Time 3133- 3151 (0.3 mins)
Time 3356- 3448 (1.9 mins) 0.54 Miles 4 Secs (1 Start) Spd 11.0 20 Secs (5 SS) Spd 13-19 Does not report to a RSE for another 4.7 Mins 41 Secs (10 SS) Spd 13-19 Periodic 26 Stop 2 Start 2 Capacity 30/30 Periodic 20 Stop 0 Start 0 Deleted Deleted from SS from Time 3133- 3276 (2.4 mins)
Deleted SS Time 3244 – 3356 (1.87 mins) 0.69 Miles 95 additional snapshots are deleted before The vehicle interacts with another RSE
Deleted Snapshots by Location First RSE Interaction Last RSE Interaction
Actual = 234 sec Calculated = 236 sec Error = 1% A =100 C = 120 E = 20% A =200 C = 179 E = 11% A = 574 C = 242 E = 58% A = 154 C = 168 E = 9% A =279 C = 220 E = 21% A = 120 C = 100 E = 17% A = 260 C = 262 E = 1% A =321 C = 159 E = 50% A =363 C = 292 E = 20% A = 151 C = 174 E = 15% A = 460 C = 483 E = 5% A = 160 C = 195 E = 22% Estimating Travel Time from Snapshots OVERALL Actual = 94 minutes Calculated = 67 minutes Error = 29%
Preliminary Observations • For uncongested conditions: • the default strategy provides fairly good geographic coverage and accuracy • For congested conditions even with relatively closely spaced RSEs: • The default plan results in significant buffer overflow • The deleted snapshots leave significant geographic gaps • Gaps have impact on accuracy of travel time estimation
Analysis: Next Steps • Evaluate more Data Sources • Columbus, Ohio GPS • Salt Lake City, Utah I-15 GPS runs • Dulles Toll Road GPS runs • I-66/Route 50 GPS runs • NGSIM validation data • Evaluate VISSIM simulated runs • Test alternative thresholds and strategies for VII probe message process • Test sensitivity to a range of RSE locations and densities