Download

1 / 36
360 likes | 487 Views
Motorcycle Data Analysis in Illinois. Mehdi Nassirpour, Ph.D. Illinois Department of Transportation Division of Traffic Safety. Objectives. Develop Motorcycle Data Using 2005-2008 FARS and Crash Data and CODES Data. Figure 1: Motorcyclist Fatalities. Projected Figures.

E N D
Motorcycle Data Analysis in Illinois Mehdi Nassirpour, Ph.D. Illinois Department of Transportation Division of Traffic Safety
Objectives • Develop Motorcycle Data Using 2005-2008 FARS and Crash Data and CODES Data
Figure 1: Motorcyclist Fatalities Projected Figures
Figure 2: Percent Occupant Deaths in Cars and Motorcycles (2005-2008)
Figure 3: Motorcycle Fatalities, Total Injuries, and A-Injuries by Selected Months (2005-2008)
Figure 4: Motorcycle Fatalities, Total Injuries, and A-Injuries by Age Group (2005-2008)
Figure 7: Motorcycle Fatalities, Total Injuries, and A-Injuries by Age of Motorcycle (2005-2008)
Figure 8: Motorcycle Fatalities, Total Injuries, and A-Injuries by Day of Week (2005-2008)
Figure 9: Motorcycle Fatalities, Total Injuries, and A-Injuries by Urban/Rural (2005-2008)
Figure 10: Motorcycle Fatalities, Total Injuries, and A-Injuries by 23 County Model Location (2005-2008)
Figure 11: Valid Driver License Status for Fatalities for Passenger Vehicles and Motorcycles by Year (2005-2008)
Figure 12: Percent Fatalities by Motorcycle Engine Size (2005-2008)
Figure 13: Motorcycle Fatalities, Total Injuries, and A-Injuries by Time of Day (2005-2008)
Figure 14: Percent Alcohol Related Fatalities and Percent Belted Occupant Fatalities by Time of Day in Illinois in 2008
Figure 15: Linked Data Process Crash Hospital Inpatient Augmented with Data from Trauma
Figure 18: Percent Head Injuries by Helmet Status Total helmeted =191 Total not Helmeted =493
Figure 19: Percent Motorcycle Injuries by Police Reported Injury Type and Helmet Status Total helmeted =191 Total not Helmeted =493
Figure 23: Severity of Head Injuries– Charges Total N=706 Total Head Injury = 273 (39%)
Figure 24: Upper and Lower Extremity Injuries– Charges Total N=706 Total Upper Extremities 333 (47%) Total Upper Extremities= 379 (54%)
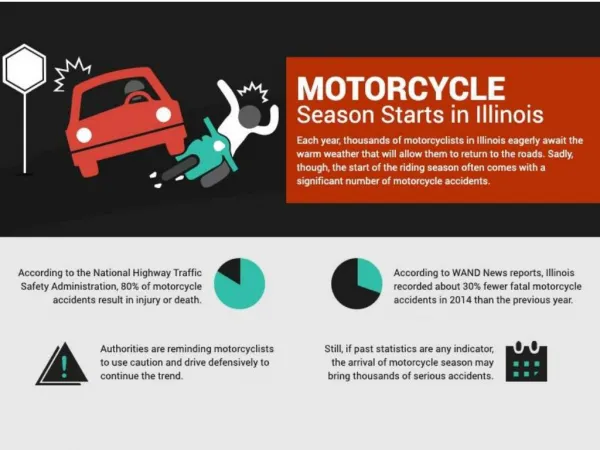
What We Know about Motorcycles Motorcyclists have high death rates Motorcycle deaths are increasing Motorcycles are becoming popular About 50% of motorcycle driver deaths involved in Single vehicle crashes Demographics--average age of riders is going up (37) Engine size is increasing—The higher the engine size, the higher the probability of being fatally injured
What We Know about Motorcycles Rider Characteristics differ by types of motorcycles Alcohol use is a problem among motorcyclists Supersport motorcycles have the highest overall collisions Motorcycles don’t have safety gear that is comparable to what we found in passenger cars Rider safety training and education tend to reduce motorcycle related crashes (based on anecdotal information). It should be noted that the relationship between the rider training and reduction of crashes has not been established yet.
Future Plan (Program Side) increase access to rider education programs Increase the proportion of motorcyclists who are properly licensed; reduce the number of motorcyclists riding while impaired; increase motorcyclists’ visibility; increase helmet usage; and increase other motorists’ awareness of motorcyclist
Future Plan (Data Side) • Sample Survey (SOS): Draw a sample of all motorcycle owners and send out a survey questionnaire to find out the following information: • VMT • Month/week of riding • Drinking and riding • Helmet Use • Previous crashes • Purpose of riding (e.g., work or pleasure) • Training status
For more information refer to Our Website at: http://www.dot.il.gov/trafficsafety/tsevaluation.html