Download
1 / 15
150 likes | 234 Views
Explore the predictive power of vector analysis in tree growth response studies following individual tree fertilization trials in Adirondack Park. Understand the implications of nutrient deficiency and the ecological impact on species like sugar maple and American beech.

E N D
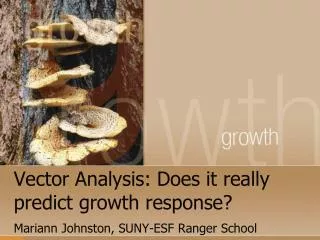
Vector Analysis: Does it really predict growth response? Mariann Johnston, SUNY-ESF Ranger School
Shoestring Satellite Experiment:The Adirondack Screening Trials • Individual tree fertilization trials • James F. Dubuar Memorial Forest, Adirondack Park • 2 Species • Sugar maple (dom/codom, ~30 cm dbh) • Am. beech (intermediate, ~10 cm dbh) • 6 Treatments screened
Shoestring Satellite Experiment:The Treatments • Control • N1: 30 N (urea) • N1P1: 30 N + 30 P (MAP + urea) • N2: 200 N • N2P2: 200 N + 100 P • N2P2KB: 200 N + 100 P + 200 K + 3 B Shoestring Project Prelim One-time application
Timeline • 2010 • May: Fertilized, Measured • July-Aug: Foliage collected, dried, weighed • 2011 • Feb-Apr: ICP and C/N analyses • July: Vector analyses presented • Nov: Remeasurements • Today: Two-Year Basal Area Response
Vector Analysis • Foliar diagnostic technique • Predicts nutrient deficiencies • Assumes that foliage response is a predictor of tree yield response • Did it work?
Sugar Maple • Vector analysis said: • Response to N2P2KB will occur • N, P, K were deficient
Sugar Maple Growth Response No significant differences between treatments
American Beech • Vector analysis said: • No growth response to any fertilization treatment will occur
Beech Growth Response p-values: 0.003 0.02 0.07 0.09 0.17
Conclusions • Did vector analysis predict growth response? • No, not really (2-yr BA) • But . . . • Foliage-damaging spring freeze occurred at time of fertilization • Height, volume growth were not analyzed • Continue monitoring for future responses
Conclusions • Beech responded to fertilization! • Intermediate crown class, understory cohort • Is beech a ‘nutrient hog’? • What are the ecological implications?
Graphical Vector Analysis 100 Relative Foliage Biomass E: Toxicity D: Luxury Consumption C: Deficiency B: No Change F: Antagonism A: Dilution
Sugar Maple Growth • Mean dbh Yr 0: 34.6 cm • Mean dbh Yr 2: 35.0 cm • Average BA response of 2.4% • No differences between treatments were detected • Predicted growth responses not apparent in diameter response
Beech Growth • Mean dbh Yr 0: 9.9 cm • Mean dbh Yr 2: 10.7 cm • Average BA response of 18.1% • All treatments showed significant (p < 0.05) growth compared to control except for N2 (200 kg N)