Download
1 / 10
100 likes | 280 Views
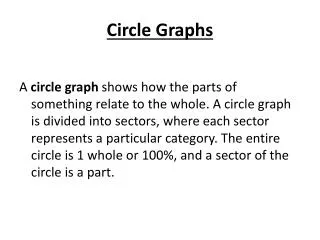
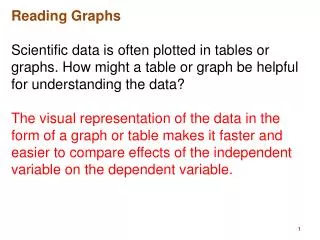
Section 8.2. Reading Circle Graphs. Circle Graphs. A circle graph is often used to show percents in different categories, with the whole circle representing 100%. Martin-Gay, Prealgebra, 5ed. Bowling 17%. Walking 37%. Biking 21%. Swimming 25%.

E N D
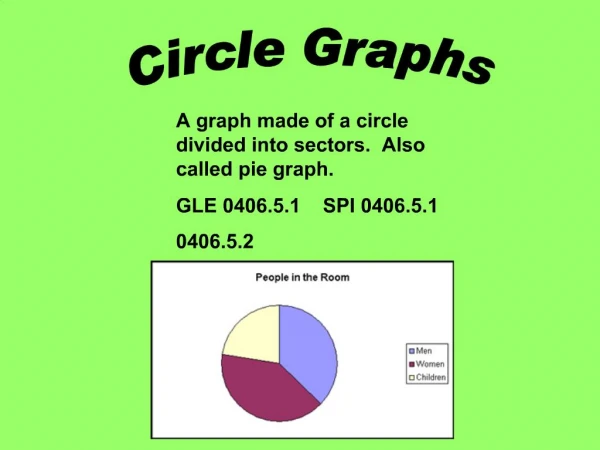
Section 8.2 Reading Circle Graphs
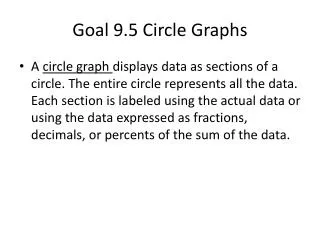
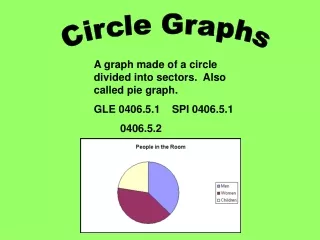
Circle Graphs A circle graph is often used to show percents in different categories, with the whole circle representing 100%. Martin-Gay, Prealgebra, 5ed
Bowling 17% Walking 37% Biking 21% Swimming 25% A telephone survey was taken to identify favorite sport activities. The results of the four most popular activities are shown in the form of a circle graph below. Martin-Gay, Prealgebra, 5ed
360° Drawing Circle Graphs To draw a circle graph, we use the fact that a whole circle contains 360° (degrees). Martin-Gay, Prealgebra, 5ed
The following table shows the percent of U.S. armed forces personnel that are in each branch of the service. Source: U.S. Department of Defense
To draw a circle graph showing this data, we find the number of degrees in each sector representing each branch of service. Martin-Gay, Prealgebra, 5ed
We draw a circle and mark its center. Then we draw a line from the center of the circle to the circle itself. We use a protractor to construct the sectors. We place the hole in the protractor over the center of the circle. Then we adjust the protractor so that 0° on the protractor is aligned with the line that we drew. Martin-Gay, Prealgebra, 5ed
To construct the “Army” sector, we find 119° on the protractor and mark our circle. Then we remove the protractor and use this mark to draw a second line from the center to the circle itself. Martin-Gay, Prealgebra, 5ed
To construct the “Navy”sector next, we follow the same procedure as before except that we line 0° up with the second line we drew and mark the protractor this time at 97°. Martin-Gay, Prealgebra, 5ed
We continue in this manner until the circle graph is complete. Martin-Gay, Prealgebra, 5ed