Download

1 / 8
80 likes | 198 Views
Circle Graphs. Unit 3 B. Warm-up. 3 % of 515 Sara and Sue are planning a party. They have a budget for expenses of $150. They buy paper products for $37, food for $75, and decorations for $29.90. They will have to pay tax of %6. Do they have enough money? Explain. For your Glossary.

E N D
Circle Graphs Unit 3 B
Warm-up • 3% of 515 • Sara and Sue are planning a party. They have a budget for expenses of $150. They buy paper products for $37, food for $75, and decorations for $29.90. They will have to pay tax of %6. Do they have enough money? Explain.
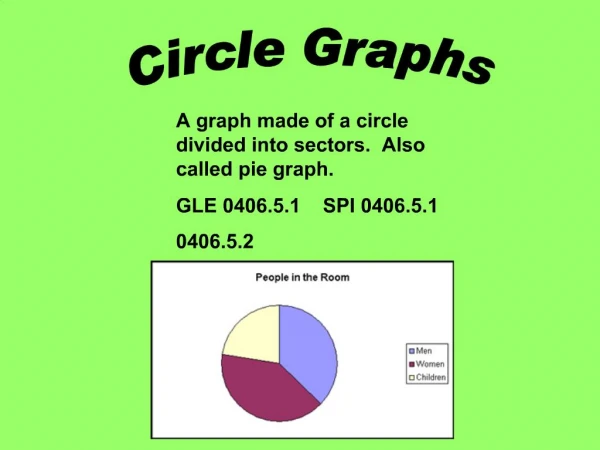
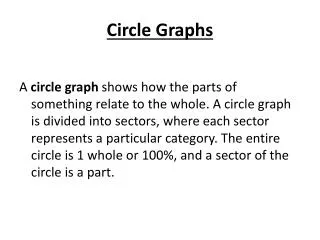
For your Glossary • Circle Graph: A graph that displays categorical data in the form of a circle. The circular region is divided into a number of pie-shaped sectors to represent portions of the data. This type of graph is sometimes referred to as a pie chart. Unit 3B
How a Circle Graph Works • A circle graph shows how parts relate to a whole and to each other. The area of each sector indicates the percentage of the whole that the part represents.
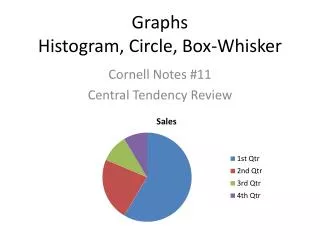
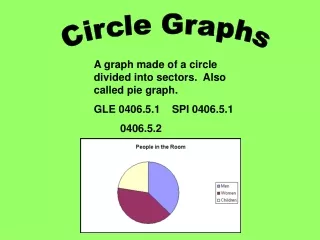
Example circle graph: In this example, Clinton had almost 50% of the popular vote, so the red sector fills in half of the circle. Dole got a smaller percentage of the popular vote than did Clinton, but he got more than Perot did. So the green and blue sectors have been filled in proportionally.
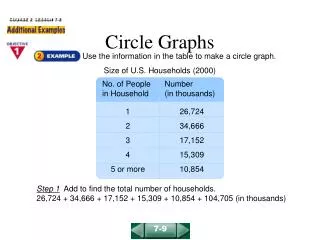
How to Make a Circle Graph • In our example, the data for the 1996 Presidential election (popular vote) is: • so to find the angle for each sector we divide the number of votes by the total votes to find the fraction of the whole, then multiply by to find the number of degrees for the sector.
So the sector for Clinton would have an angle of: 360˚=180˚ • The sector for Dole would be:360˚= 149˚ • Perot's sector: 360˚= 31˚ • 180 + 149 + 31 = 360