Download
1 / 25
270 likes | 440 Views
School Organization and Finance. EDN200. Today’s Plan. Small group work – discuss school funding articles School Organization and Finance KEY QUESTIONS Funding Activity Review Research Presentation Research Presentation Sign-Up. Small Group Work. Quick summary of the article

E N D
Today’s Plan • Small group work – discuss school funding articles • School Organization and Finance • KEY QUESTIONS • Funding Activity • Review Research Presentation • Research Presentation Sign-Up
Small Group Work • Quick summary of the article • Your insight or takeaway from the piece • Why should we care?
5 Major Questions • Who do teachers work for? • Where do schools get their money? • Is school funding equal? • What are the effects of unequal funding? • Where does the money go?
Question #1 • Who do teachers work for?
Teachers Students & Parents
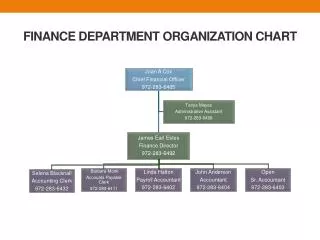
Superintendent Assistant Superintendents School Principal Teachers Students & Parents
State Department of Education School Board elected/appointed Superintendent Assistant Superintendents School Principal Teachers Students & Parents
Governor/Legislature/Courts State Board of Education State Superintendent/Chief State School Officer State Department of Education School Board elected/appointed Superintendent Assistant Superintendents School Principal Teachers Students & Parents
Question #2 • Where do schools get their money?
Dollars Spent On Public Education in the U.S. (2002/2003) • $440 billion total Sales and Income Taxes, Lottery, other Primarily Property Taxes
Federal Spending • $586.1 billion (+7.0%) - Social Security • $466.0 billion (+4.0%) - Defense • $394.5 billion (+12.4%) - Medicare • $367.0 billion (+2.0%) - Unemployment and welfare • $276.4 billion (+2.9%) - Medicaid and other health related • $243.7 billion (+13.4%) - Interest on debt • $89.9 billion (+1.3%) - Education and training • $76.9 billion (+8.1%) - Transportation • $72.6 billion (+5.8%) - Veterans' benefits • $43.5 billion (+9.2%) - Administration of justice • $33.1 billion (+5.7%) - Natural resources and environment • $32.5 billion (-15.4%) - Foreign affairs • $27.0 billion (+3.7%) - Agriculture • $26.8 billion (+28.7%) - Community and regional development • $25.0 billion (+4.0%) - Science and technology • $20.1 billion (+11.4%) - General government • $1.1 billion (-47.6%) - Energy
Question #3 • Is school funding equal?
Not equal across states NC per pupil funding is 39th out of 50 U.S. States National School Boards Association, 2005
Not equal within NC • Hyde County - $14,975 • Davidson County - $6,139 A difference of $8,836 • Source, NCPS Statistical Profile
Question #4 • What are the effects of unequal funding?
Self-Fulfilling Prophecy • High Profile Indicator of School Success - Test Scores • High Test Scores Drive Up Property Values • High Property Values Increase Tax Base • Increased Tax Base Yields Greater Per Pupil Expenditures • More enrichment programs, greater resources, smaller classes, more personnel, more subjects, more counselors, more fieldtrips, more, more, more • More of Everything Leads to Increased Test Scores • Repeat the Cycle
Self-Fulfilling Prophecy - In Reverse • Low Performing Districts Serving Larger Numbers of Students Below State Averages • Property Values Decline or Don’t Keep Pace with Neighboring Districts (Tax Rate Increases) • Tax Base Doesn’t Keep Up with District Costs • Increased salaries, health care, testing, etc. • Per pupil expenditures reduced • Reduced funding leads to fewer extracurricular activities, less resources • Less of everything has negative impact on test scores and/or change in instructional focus • Repeat the Cycle - Less Money for those kids most in need
Question #5 • Where does the money go?
An Example • New Hanover Public Schools 65% salaries 15% benefits 10% supplies/materials 10% services .1% equipment
Why is money an ineffective way to measure district commitment to schools? • % of students with special needs (receiving support services) varies widely • School maintenance/construction costs vary (location, age of buildings) • Personnel experience varies widely (Teacher Salaries 28K – 66K in NC) • Central Office/Administrative Staff vary across districts • Class Size/Building Capacity Issues
Research Presentation • Review Presentation Rubric