Download
1 / 24
240 likes | 481 Views
Comparison of non-invasive spectroscopic techniques for determination of alcohol content of spirits. Angela Mills, Carol Sneddon, Alison Nordon, Colin A. McGill and David Littlejohn, Department of Pure and Applied Chemistry/CPACT, University of Strathclyde, Glasgow. Introduction.

E N D
Comparison of non-invasive spectroscopic techniques for determination of alcohol content of spirits Angela Mills, Carol Sneddon, Alison Nordon, Colin A. McGill and David Littlejohn, Department of Pure and Applied Chemistry/CPACT, University of Strathclyde, Glasgow.
Introduction • Customs and Excise require alcohol content to be determined to ±0.05 % V/V • Current methods based on density measurements • Invasive • Off-line • Time consuming • Destructive • Off-line NIR spectrometry method has been approved
On-line analysis • In-line • Probe positioned in pipe and sample analysed prior to being bottled • Non-invasive • Analysis of sample in bottle • Bottling line • Counterfeit detection
Non-invasive analysis • Two techniques investigated for the non-invasive determination of alcohol content • NIR • Raman • Applicability of techniques assessed in terms of • Accuracy • Precision • Ease of constructing and maintaining an on-line calibration model
Samples • 23 samples provided by Guinness United Distillers and Vintners • 12 whiskies (20.15-61.68 % V/V) • 7 vodkas (19.91-63.27 % V/V) • 4 ‘sugary’ drinks (19.96-20.36 % V/V)
Zeiss Corona 45 NIR • Reflectance mode instrument • Tile used to reflect light back to collection fibres • Empty bottle used for reference measurement • Measurement time = 300 ms
Kaiser Holoprobe Raman • 785 nm laser • Non-contact optic attached to probe head, which is connected to spectrometer by fibre optic cable • Probe to bottle distance = 5.5 cm • Measurement time = 3 min
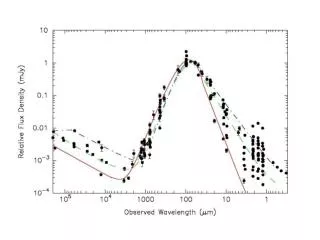
increasing alcohol concentration NIR spectra
Repeatability † 1st derivative spectra of ~ 20 % ethanol/water
Prediction of alcohol content • Data analysis carried out using MATLAB v 6.1 and PLS_Toolbox v 2.1.1 • 7169-10437 cm-1 region of 1st derivative spectra • Selection of initial samples to construct calibration model • PCA • Maintenance and update of model as new samples analysed • Combined PCA/PLS algorithm (S.K. Setarehdan et al, Anal. Chim. Acta, 2002, 452, 35)
Combined PCA/PLS algorithm • Build PLS calibration model with initial samples • Use PCA to assess similarity of new sample to those already included in PLS calibration model • If sample different add to calibration model • If sample similar predict composition using calibration model
actual calibration + prediction alcohol concentration/(% V/V) Addition of new samples to model
Prediction of alcohol content † average ± std dev (n=5)
Repeatability † 1st derivative spectra of ~ 20 % ethanol/water ‡ shorter exposure time used
Conclusions – NIR and Raman • Signals from both techniques, particularly Raman, affected by bottle • Diameter of bottle may limit use of NIR • Use transmission rather than reflectance mode Zeiss Corona • NIR analysis based on water signal whereas Raman analysis based on alcohol signal • Multivariate analysis required for NIR whereas a simpler univariate method can be employed for Raman • Model maintenance and update could be carried out using combined PCA/PLS algorithm for NIR
Conclusions – NIR • Can predict alcohol content of whiskies and vodkas with average % error of 1 % • Prediction of ‘sugary’ drinks poor separate calibration model required • Average RSD of 0.5 % (n = 5) • Not as accurate or precise as off-line NIR method employed by Guinness UDV • Employs greater number of calibration samples and different models may be required for different types of drinks • Non-invasive NIR would allow for more samples to be analysed may be able to tolerate lower accuracy and precision
Acknowledgements • Paul Lockyer, Guinness United Distillers and Vintners • John Andrews, Clairet Scientific