Download
1 / 53
530 likes | 681 Views
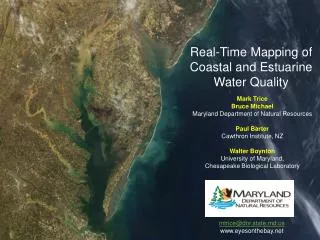
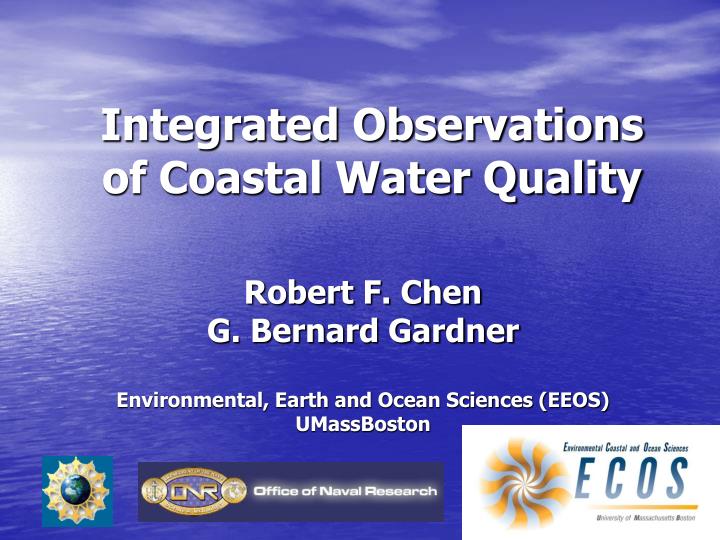
Integrated Observations of Coastal Water Quality. Robert F. Chen G. Bernard Gardner Environmental, Earth and Ocean Sciences (EEOS) UMassBoston. What is Water Quality?. Is this water clean or dirty? Threats to humans? Bacterial pathogens, viruses Threats to ecosystem? Nutrients Metals

E N D
Integrated Observations of Coastal Water Quality Robert F. Chen G. Bernard Gardner Environmental, Earth and Ocean Sciences (EEOS) UMassBoston
What is Water Quality? • Is this water clean or dirty? • Threats to humans? • Bacterial pathogens, viruses • Threats to ecosystem? • Nutrients • Metals • Sediments • Persistent Organic Pollutants (PAH, PCB) • Biologically active compounds (Env. Endocrine Disruptors, antibiotics, pharmaceuticals) • Need indicators
GCMS Trace of DI Sewage Influent Caffeine DEET 4-Nonyl-Phenol Bis-2-Ethylhexyl Phthalate Bisphenol A
United Nations Educational, Scientific and Cultural Organization (2003)
Possible Indicators • Rapid Colilert • DNA microarrays • Pyrene • Caffeine • Others? • Sensors to give measurements on appropriate temporal and spatial scales (similar to CTDs)
Bacterial Indicators
Boston Harbor--Nonylphenol Estimated estrogen concentrations in fM EEQ 42.45 15 37 37 15 227 42.40 66 66 Outfall 368 29 368 29 29 42.35 199 301 4100 Latitude 199 44 44 47 126 174 42.30 105 105 42.25 42.20 -71.1 -71.0 -70.9 -70.8 Longitude
PYRENE EPA Priority Pollutant 10 - 200 ng l-1 in estuarine waters 5-15% of total PAH in water column 128 nsec fluorescence lifetime in water
June, 2004 Pyrene (ng/l) • >1300 pyrene measurements in 5 days • Maximum downstream of Manhattan
Coastal Waters are COMPLEX • Each Estuary/Coastal area is unique • Tides (hourly monitoring) • Topography (10s of meters) • River flow variations (rain events) • Spills (immediate response) • Multiple sources (local understanding)
Urban Oceanography • Anthropogenic effects are high in areas of limited access • Shallow • Tides • Low bridges • Point sources • Complex mixing
Modeling Needs • High resolution temporal coverage • High resolution spatial coverage • Simple understanding/definition of water quality impacts • Physical model integrating water flow and water circulation • Land-based (anthropogenic) forcing (GIS)
The Integrated Coastal Observation System (ICOS) • ECOShuttle • Entire Hudson Estuary investigation about 24 hours-4 deployments • June, 2003 • May, June, Sept., 2004 • Pumping System • Adaptive or Continuous Sampling • TOC/TN • Nutrients
ECOShuttle • SeaBird CTD • SeaPoint Chl, OBS • SeaTech CDOM • Chelsea UV Aquatracka • Altimeter • Optical Plankton Counter (Brooke) • Video Plankton Recorder (SeaScan) • Submersible Pump
Mapping • High Resolution • ~1 m vertical, <1 km horizontal • Up to 6 Hz data rates • Synoptic • ~8 knots speed • Mini-Shuttle capable of surface mapping
Uncontaminated Seawater Pumping System • All teflon and stainless steel • 8 l/min flow rate, samples after ~3 min delay
Hudson River EstuaryJune, 2004 Raritan Hudson Schmutz?
Nutrients East River Newark Bay
MiniShuttle • CTD, CDOM, Chl, DO • All sensors within 4 cm vertically
Involve Stakeholders/Locals In All Aspects of Observation and Modeling • End-users/decision makers/public need to participate in planning so that they can use products • Examples: • San Francisco Bay • Neponset River • Hudson River • Boston Science Partnership
Ocean Education • Ocean Literacy • Ocean makes the planet habitable • Ocean has unique environments • Ocean and land are linked • Ocean and man are linked • Keep data and model products simple • Partner with existing infrastructure to maximize impacts
Summary • Coastal Areas are COMPLEX • Indicators are needed to make water quality SIMPLE • Model products need to be SIMPLE • End-users need to be involved upfront—they are the resident EXPERTS • Educate EVERYONE
Next Steps • Biological and chemical sensor development • Moorings • Regular and targeted surveys • Access to data in usable forms • Integration of Bio/Chem data into models • Integration of Research and Education
Hudson River Estuary Hackensack Manhattan Newark Bay Staten Island Raritan
Integrated System • Physical (T, S, Meteorology, LISST, dye) • Chemical (DO, CDOM, AC-9) • Biological (Chlorophyll, OPC, VPR)
Acknowledgements • Steven Rudnick, Francesco Peri, Liannea Litz, Zhen Wang, Huang Wei • LaTTE • National Science Foundation • Office of Naval Research
Educational Outreach • Aquaria and Museums • Watershed Integrated Sciences Partnership (WISP) • New England Center for Ocean Science Education Excellence (NE-COSEE) • Work with Teachers • Classroom Activities
Gulliver’s Creek Granite Ave. Bridge