Download
1 / 30
320 likes | 533 Views
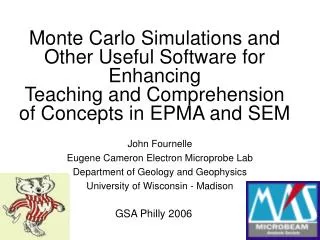
Electron Microprobe Techniques for use in Tephrochronological Analyses. J. Fournelle, K. Severin, K.Wallace, J.Beget, J. Larsen. Material in Poster V33B-0663 presented at AGU December 2006 in “Tephra Dispersal and Sedimentation: Field Studies, Modeling, and Hazard Assessment III” session.

E N D
Electron Microprobe Techniques for use in Tephrochronological Analyses J. Fournelle, K. Severin, K.Wallace, J.Beget, J. Larsen Material in Poster V33B-0663 presented at AGU December 2006 in “Tephra Dispersal and Sedimentation: Field Studies, Modeling, and Hazard Assessment III” session
Tephrochronology generally assumes that a layer of volcanic ash represents a snapshot of eruption/deposition and of a region within the subvolcanic magma chamber. Correlation of tephra deposits over long distances helps establish age control for other deposits (volcanic and nonvolcanic). Reliable correlations depend on establishing similarity among tephra deposits. Although multi-parameter characterization of a tephra enhances long-distance correlations, identification and correlation of unknown tephras is often done using only geochemical analyses. Techniques vary but generally deal with chemically characterizing all (bulk) or portions (glass, crystals) of the tephra layer, with various geochemical techniques at various spatial scales. Electron probe microanalysis (EPMA) is the most commonly used analytical tool for geochemical analysis and imaging of micron-size volumes of glass and crystals. However, a standard method for collecting, reducing, and reporting tephra data among and within laboratories is not common practice, making comparison of data sets problematic. There is also a range of proficiencies, from advanced to introductory: some EMP and SEM labs have mature established procedures, whereas other labs may have little experience with this somewhat specialized work (hey, someone comes and asks you if your probe will do glass analysis...of course it will).
INQUA/Froggatt (1992) Recommendations Froggatt (1992), reporting on the 1990 INQUA's Committee on Tephro- chronology, listed recommendations related to quality control of EPMA data: (3) All EMP data should be accompanied by a statement of probe make and model, whether WDS or EDS, and accelerating voltage, beam current (Faraday or absorbed on some standard), and beam diameter. If referenced to earlier work, that should be readily available. (4) All tephra analyses should be based on common working standards, similar to the unknowns. At present the best are KN18 and VG99. Also suitable minerals are feldspar OR1A, Kakanui Augite, and Engels amphibole. (5) All published EMP analyses should be accompanied by typical analyses, or the mean, and other statistics on one or more standards, especially for glass data, or reference to where these standard data are available (6) All EMP analyses of volcanic glass should use an electron beam defocussed to at least 10 um diameter to reduce potential loss of Na and other elements. (continued on next slide)
INQUA/Froggatt (1992) Recommendations-continued (7) Give single shard analysis, rather than averaging out heterogeneity. (8) All glass EPMA should be of freshly exposed (polished) internal surfaces. (9) EMP data on glass should be normalized to 100% to facilitate proper comparison. The deficiency from 100% can be recorded as 'water by difference' or the original analysis totals listed. (10) A minimum of 10 analyses on different shards should be collected. (11) All data should be examined for homogeneity, and unusual standard deviations explained. (12) Minimally publish: mean and std dev of each element, after normalization; 'water by difference' or original analysis totals; number of separate shard analyses in the mean. Also (3) and (5) should be noted.
Survey of Recent Tephrochronology Publications Reporting EPMA Glass Chemical Data To better understand the extent of EPMA use in tephrochronology, and how EPMA operation was documented, a literature survey was done recently by searching bibliographic databases with the terms tephra + chronology + glass. Around 200 articles were then checked to find those with published glass analyses by EPMA. 52 articles were found with EPMA data, 39 published since 2000, and 46 published since 1996 (these figures are weighed toward those journals with online pdf files). There are about 2 dozen laboratories represented, of which 13 are recognized by name as established EPMA facilities with dedicated WDS electron probes (Cameca camebax, sx50/51, sx100; Jeol 733, 8600, 8900; Microscan V), the balance SEM facilities plus 6 "mystery" labs (no details given in the publications about their equipment).
Reporting basic conditions…. some well done, others not so well done…
Reporting conditions related to element mobility (e.g. Na) in glasses…. some well done, others not so well done…
Normalization of tephra glass is somewhat controversial; a good argument has been made that even if it is done, the original values should be able to be recovered.
Suggestions by Hunt and Hill J.B. Hunt and P.G. Hill in a series of papers (1993, 1996, 1998) followed up Froggatt's challenge to the tephrochrology and EPMA communities. In “Tephra geochemistry: a discussion of some persistent analytical problems” (1993, The Holocene 3, p. 271) they agreed with many of Froggatt's suggestions, but questioned others, e.g., the acceptance of "low totals" via data normalization. They also pointed out that it is not just Na (and K) that are "lost" in EPMA, but other elements (Al, Si) increase under beam irradiation. They argued that some North Atlantic tephra EPMA data are of poor quality and "normalization to 100%" permits erroneous conclusions as errors in analysis are allowed. They suggested not using any analysis with a total <95%, that >2 wt% H2O implies alteration of a glass, inappropriate operating conditions, poor sample selection, or poor sample preparation. (They did not address the question of the situation where the only glass available is truly hydrated). They gave a list of 8 EPMA parameters that should be included in any publication. They repeat many of those listed by Froggatt (1992), but add counting time (peak and background), total analysis time (x-ray counting), and exposure time (beam on, on the sample).
Suggestions by Hunt and Hill - continued In the 1996 paper "An inter-laboratory comparison of the EPMA of glass geochemistry" (Quaternary International 34-36, p. 229), they report on a round robin of 7 northern European EPMA labs, where a rhyolitic glass (Lipari obsidian) was analyzed. There is a large amount of scatter of the plotted data (Na2O vs SiO2). Only 4 probes (2 of them theirs) at 3 labs “submitted precise and accurate data”. (The labs were not identified, as some of the results were clearly erroneous, with several operator and instrumental issues later identified, e.g. failure to carbon coat causing extreme Na enrichment and Si loss, and analysis of the edge of the material, and standarization and analytical procedure problems. They observed a difference between the results of using a ZAF vs PAP (phi-rho-Z) matrix correction (the ZAF gives 1 wt% lower SiO2). "The magnitude of the discrepancies seen in the inter-laboratory programme, if repeated in tephra analysis, may be sufficient to result in miscorrelation to volcanic source, in a failure to distinguish discrete tephras, or in faulty correlation between tephras, all of which could have important tephrochronological consequences." (p. 237)
Suggestions by Hunt and Hill - continued "The reliability of published tephra geochemical data can be gauged by the wider tephra communigty only by the inclusion of representative geochemical analyses of an secondary glass standard acquired during the same analytical session in which the tephra was analyzed. At the 3rd U.K. tephra meeting in Cheltenham in 1994, the U.K. tephrochronology community agreed to a publishing protocol using the Lipari obsidian as a secondary standard." (p. 237) In “Interlaboratory comparison of electron probe microanalysis of glass geochemistry” (Hunt et al, 1998, ODP Report), the results of another round robin are given, this time with 5 labs, 3 from the U.S. (and they are identified). All but one lab show similar data. One feature, not discussed, is the slight but clearly evident shift to higher Na2O (0.3 wt%) and lower SiO2 (0.4 wt%) by the one lab that used the Nielsen and Sigurdsson (1981) time series t=0 extrapolation (figure in following slide).
“Volatile” or Mobile Elements... beam size matters Six papers in over the past 25 years have considered the problems of mobile elements in volcanic or experimental glasses under the electron beam, and suggested procedures for either reducing/eliminating the need for correction, or a time series method for correction. *1981: Nielsen and Sigurdsson (Am. Min.) demonstrated the exponential decay of Na under a focused 20 nA beam on anhydrous rhyolite (KN18, see figure to right), and showed that a time series of 2 second counts count be modelled to yield the Na value at t=0. They concluded that this reduced the errors greatly, but not totally--the result was 1-3% low (relative).
1995: Devine et al (Am. Min.) evaluated hydrous Si-rich glasses using this time series technique and showed that Na and K could be corrected well and yielded totals whose deficiency were very close to known H2O contents (up to 6 wt%). They noted that defocussing the beam to 15 microns eliminated almost all of the Na loss. Also they noted that Na loss in basaltic glass under the (defocussed?) beam is neglible. • Re this time series extrapolation method: neither Jeol or Cameca offer this as a software option; currently the only commercially available option is in the Probe for Windows software (where it is applied before the matrix correction.) Thus almost everyone uses the defocused beam method.
* 1995: Spray and Rae (Can. Min.) presented a review of the physics of the phenomenon (i.e., heating and development of a space-charge layer), and pointed out a study (unclear what the glass composition was) where low current (0.2 nA), defocussed beam and high keV (esp. 30 keV) yielded virtually no drop in Na counts. They showed Na drop in basaltic glass VG2 with a fixed beam at 2.5 nA (15 keV), but none when defocussed to 20 um.
* 1996: Morgan and London (Am. Min.) also considered hydrous Si-rich glasses, quantifying the effect on Na, K, Al and Si. Showed that for currents >5 nA, the time series extrapolation to t=0 does not retrieve counts lost in the first instants of irradiation. They concluded that optimal EPMA acquisition of Na, K, Al and Si was with as low current (e.g. 2 nA) and beam diameter the largest possible (15-20 um) with long counting times (20-40 sec) to improve statistics. The remaining elements could be measured with a second pass at 20 nA beam. For hydrous glasses where less than a 15 um beam is used, similar treatment will be calibrated on a glass standard of similar H2O content, and a correction factor determined and applied.
* 2001: Hunt and Hill (J. Quat. Sci.) (figure below) evaluated different beam sizes and concluded square beam rastering (10-15 um width) was their preferred technique, using 20 keV and 15 or 20 nA to probe dacitic glasses.
* 2005: Morgan and London (Am. Min.) addressed the problem of small glass inclusions, evaluating 2-50 nA currents, 2-20 um beam diameters, at 20 keV. They recommended using ≤ 2 nA and ≥ 5 um beam size, counting for 30 seconds for improved statistics. For <5 um, correction factors (on standards) are determined and applied. They compared element migration effects per current density (nA/microns squared) as shown in their Table 2 below, and Figure 3C. They also addressed the issue of mixing various beam size conditions in intra- and inter-sample comparisons, recommending that only one size, the largest spot size that can be accommodated by all samples/inclusions, so that all are treated similarly.
VG568 Glass Standards in EPMA A critical component of a “good” tephra electron probe analysis is a good standard. What makes a standard “good”? - It is homogeneous and accurately characterized -- and optimally similar in composition to the unknown. One concern must always be the presence of crystals within the standard’s analytical volume (~upper 2 microns of sample); isolated crystals can be bypassed, but pervasive devitrification can be present in materials distributed as “official standards” and need to be checked for. Above: some commonly distributed natural glass standards … not saying that all fragments are like these, but you don’t know until you look
There is now an additional source of glass standards for EPMA: the USGS for the past ~3 years has been developing and testing several remelted natural basalts. At least one glass (BIR-1G) is available from Stephen Wilson, USGS, Denver (swilson@usgs.gov) An added benefit of these compared to the original USNM glasses is that they are large in size. Some (many?) EPMA users assume that a chemical analysis distributed with a standard is the actual composition of the grains they have. While this may be true for a percentage of the cases, in general, one should assume this is the mean value of a subset of the standards distributed -- a good initial 1st approximation -- but then the lab needs to verify that, usually using a suite of other standards and checking for consistent results. Jarosewich et al (1980) state that any particular grain may not be the same composition as the published value. There are “homogeneity index” (HI) values listed (measured standard deviations divided by 1 sigma of counts), and most major elements are low (<1.5) where they say >3 is hetereogeneous. The “most heterogeneous” of the Yellowstone VG568 glass had an HI for Na of 3.45.
Evaluating EPMA Standards Part of general EPMA quality control is the verification that the mineral and glass (particularly natural) standards are actually the composition that they are supposed to be (they are not always!). The only real way to do this is to check for internal consistency amongst a suite of standards. One can use one to measure another to measure another etc. An alternative is to plot them all up together, with their nomination compositions vs their actual x-ray intensity times the ZAF of that element in that matrix. If all the standards were perfect, they would all line up on a straight line. Those falling off the line have a problem, and probably are of a somewhat different composition than the “official” composition. In a few cases (e.g. Al, Mg) peak shifts may also be involved if minerals are also used (and not peak centered individually). To the right are plots from running the program “Evaluate” (part of the Probe for Windows-Enterprise software). Std 358 needs attention.
Other EPMA quality control issues • WDS • P overlap by 2nd order Ca K • EDS • This deserves a more systematic treatment than can be done here. While EDS systems are easy to use, there are many pitfalls particularly to the unwary. And never standardless.
PET TAP Integral Integral Differential Differential In basalts this can be a significant amount of measured P! It matters whether you measure with TAP or with PET. And it is rarely mentioned in EPMA result writeups. Above left, with TAP, on P-free K412 glass (with 15.3 wt% CaO), the apparent P2O5 from the 2nd order Ca K overlap is ~0.3 wt% in ordinary differential mode PHA. Differential mode PHA removes it. With PET (right) there is sufficient separation from the P Ka peak so no PHA is necessary.
Proficiency Testing The International Association of Geoanalysts has been running a series of EPMA proficiency tests over the past ~3 years, using a series of new basaltic glass standards being developed by the USGS. Apparently the first one was a “pay to play” operation, but for the past 2 tests, they are open to anyone. The most recent one, G3, has just been completed. These are an excellent opportunity to evaluate ones EPMA operation. If you are interested in being included in the next round, contact Stephen Wilson (swilson@usgs.gov) and Phil Potts (p.j.potts@open.ac.uk)
Communication … One general observation that developed in the course of studying the literature on tephrochronology and glass EPMA is the uneven level of communication between various “players” in the game. It is understandable, people move in different circles and publish in different journals, but for a field as small as EPMA, one would think there would be more exchange. For example, Hunt and Hill (2001) apparently did not know of Morgan and London (1996), and Morgan and London (2005) did not know of Hunt and Hill (2001) -- all which dealt directly with the same topic. And Hunt and Hill (2001) apparently were unaware of the physics modelled in Spray and Rae’s 1995 paper that could have improved their paper.
Points for Further Discussion 1. Standard composition verification: Need for critical evaluation of one’s own specific glass standards used for EPMA. Can’t assume ones grains are necessarily the same as published “official values” 2. Publish standards’ EPMA as a check on procedure: Need for including EPMA measurements of secondary glass EPMA standards together with the unknown tephra analyses 3. Volatile/mobile elements: Can some optimal settings be agreed upon (keV, nA, defocussed beam diameter) for tephra glass? Basaltic vs rhyo-dacitic? How best to deal with situations where only thin glass walls are available for probing, so beam defocusing is not possible, and software for time series extrapolation is not available. 4. Low total validation: Possibility of verifying that low totals are due to hydration and not due to analytical error by measuring oxygen, where 45 or 60 LSM (”pseudocrystals”) are available. See Nash (1992) 5. Proficiency testing/round robins: Participation needs to be encouraged, particularly of those organized by the International Association of Geoanalysts (free!) 6. Consider implementation of interference correction on P K in basaltic glasses by 2nd order Ca K peak (can be a significant amount of the P)