Download
1 / 21
220 likes | 387 Views
Weather Observations and Time Zones. Val Bennington AOS 101. Types of Observations. Temperature Dewpoint Barometric Pressure Wind Speed and Direction Cloud Cover Present Weather Cloud Type Etc…. Observations are taken by automated sensors as well as by individuals.

E N D
Weather Observations and Time Zones Val Bennington AOS 101
Types of Observations • Temperature • Dewpoint • Barometric Pressure • Wind Speed and Direction • Cloud Cover • Present Weather • Cloud Type • Etc…
Observations are taken by automated sensors as well as by individuals
Temperature and Dewpoint • Both are measured with a thermometer that is shielded from direct sunlight (hygrothermometer) • Temperature around the world recorded as degrees Celsius • Scientists use degrees Kelvin • U.S. still uses degrees Fahrenheit
Dewpoint (Td) • Air around us contains water vapor • Warmer air can hold much more water vapor than cold air • Dewpoint tells us the temperature at which the current amount of water vapor would saturate the cooler air and start to condense (form dew) • If we only have a little moisture in the air, have to cool the air more to get it to condense • Think of hot chocolate --- the sugar stays mixed when it is hot, but as it cools, the sugar falls out. If you make weak hot chocolate, it has to cool more before the sugar falls out • Why do you think this is reported????
Barometric Pressure • Measured with barometer • Units of hectopascals (hPa), millibars (mb) or inches of mercury (in Hg) • Reported values are adjusted to sea level -- otherwise pressure maps would simply reflect topography
Wind Speed and Direction • Anemometer measures speed • Speed measured in knots: • 1 knot = 0.514 m/s • 1 knot = 1.151 mph • Weak hurricane has winds over 65 knots (75mph)! • Weather vane tells us wind direction • Why do we care about direction? http://www.spl.org/images/branch/BAL_art/anemometer.jpg
Clouds • Cloud amounts and height • Cloud type done only by sight www.free-online-private-pilot-ground-school.com
Upper Air Observations • Balloons with radiosondes released twice a day at 72 US stations (~900 worldwide) • Measures P,T,Td, wind speed and direction as it rises • Create atmospheric “soundings” from these observations to understand the vertical profiles of T,P,wind,Td
Australian Sounding • How does temperature change with height? Dewpoint? Wind speed? • What might the solid black lines be? • How is dewpoint related to temperature? • What is surprising about dewpoint at 6000 feet?
Station Models Lots of data on one map!
Station Map Layout http://weather.cod.edu/notes/stnmodel.html
Interpretation Temperature - Two digits for temp (C,K, or F) Dewpoint - Two digits for dewpoint (same units as T)
Interpretation Continued • Cloud Coverage - How much of the sky is covered with clouds? What fraction?
Interpretation Continued Wind Direction - Line gives direction FROM WHICH wind is coming Wind Speed - Barbs used to tell us wind speed Short barb = 5 knots, Long barb = 10 knots, Triangle = 50 knots
Interpretation Continued Surface Pressure (mb) - Adjusted to sea level. First digit is dropped! If number starts 0,1,2,3,4 -- put 10 in front of it! Last digit is after decimal point. 236 = 1023.6mb If number starts with 6,7,8,9 -- put 9 in front of it! 869 = 986.9 Pressure Tendency– Change in pressure over last three hours. Change in pressure is represented by a value and line indicating how the pressure was changing.
Interpretation Continued Visibility– How far we can see from the observing point, expressed in units of miles. Present weather conditions– Symbols are used to convey this information (rain, snow, ice, etc.).
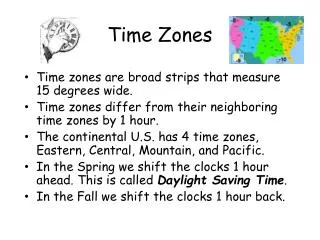
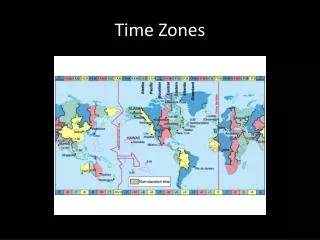
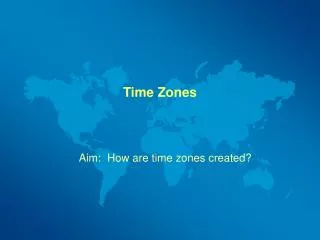
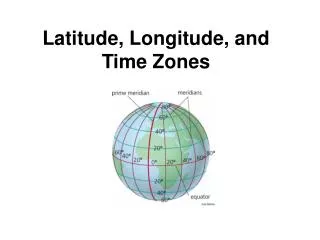
Universal Time = Greenwich Mean Time Expressed as Z or UTC: 6:00 am in London = 6Z