Download
1 / 13
130 likes | 244 Views
COST benchmark dataset homogenisation: issues and remarks of the “Slovenian team” Presentation for WG 2-4 meeting in Tarragona, March 9-11, 2009 Gregor Vertačnik Boris Pavčič Tarragona, March 2009. Overview. MASH SNHT Craddock SNHT vs. Craddock. MASH.

E N D
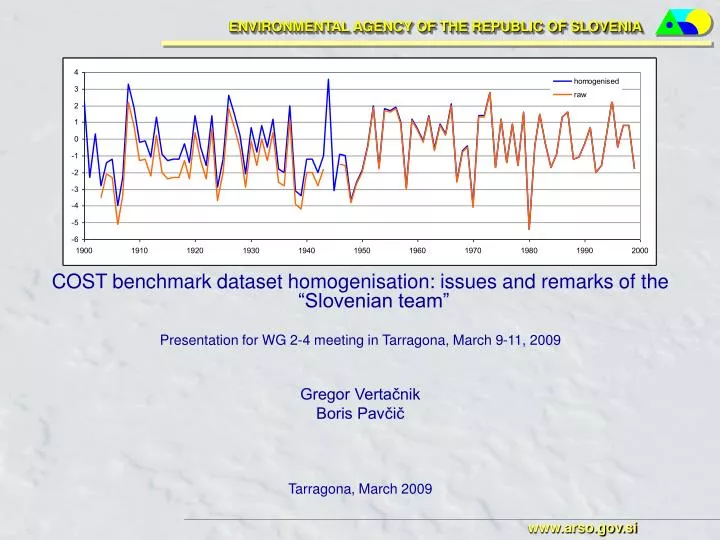
COST benchmark dataset homogenisation: issues and remarks of the “Slovenian team” Presentation for WG 2-4 meeting in Tarragona, March 9-11, 2009 Gregor Vertačnik Boris Pavčič Tarragona, March 2009
Overview • MASH • SNHT • Craddock • SNHT vs. Craddock
MASH • In February, some testing and inspection of the results of various procedures in MASH was done • Homogenisation procedure used for the benchmark: • Data formatting (COST-MASH and vice versa) • Statistical significance for break-point detection: 0.05 • Monthly outliers found by mashlier.bat • Break-point detection only on annual series (Gregor) or also on monthly and seasonal (Boris), samauto.bat, 50 iterations • All breaks and outliers found accepted
Issues: • Fully-automated version is quick • Time-consuming manual correction (mashcor.bat) and inspection (mashgame.bat) • Inconsistent results when using SAM, hard to find out the “true date” of breaks from monthly series • Homogenisation of annual series insufficient, especially for precipitation series • Some “obivous” outliers remain undetected • Problems with clustered breakpoints • Complete series of raw data needed for at least one station (surrogate temp. station network 13 problem) • Too many small breaks and outliers according to the benchmark description • Long-term trends can’t be detected, possible reconstruction only from consecutive breaks
Some obvious outliers remain after the homogenisation procedure (mashlier.bat, samauto.bat) Difference series for July (equally weighted ref. stations), tnm28070001
Fully-automated procedure “detects” numerous small breaks and outliers – possibly a consequence of an interval break-point correction • Occurence of outlier years (all months within the year are outliers) An example of CDF for inhomogenities, temperature, surrogate data, station network 000001
Fully-automated application of SAM procedure in MASH (monthly, seasonal, annual homogenisation) on the COST-benchmark sometimes result in unrealistic inhomogeniety series: • Inconsistent times of breaks • Very different monthly correction factors An example of inhomogeniety series for autumn months, temperature, surrogate data, tnm2807001
SNHT • For each candidate series one weighted reference series was calculated from all other stations • All series were tested with corresponding reference series (monthly, seasonal and yearly values) • All significant breaks were marked in a table • Only reference series without uncorrected breaks in the period used to calculate corrections were chosen • After the correction of marked breaks in the first round, all steps were repeated until no significant breaks were found • Corrections were always applied from first year to the date of break
Table of examined series with marked breaks. Numbers in yellow cells indicate the month in which the break is located.
Craddock • The Craddock approach is the same as discussed in Brunetti et al. (2006) • Corrections which were calculated for individual breaks were applied to the period between the corrected break and the next one
SNHT vs. Craddock • Comparison of detected breaks and correcting factors SNHT vs. Craddock • More breaks were detected by Craddock method then by SNHT • Correcting factors for breaks detected with both methods are quite the same
Average seasonal differences Craddock – SNHT of homogenised series (over all series) shows that the final results are similar. Differences are bigger in period where more series have missing data (beginning of the century) and in short period with lots of breaks in all series (80’s)