Download
1 / 31
340 likes | 556 Views
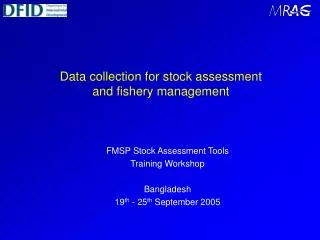
Stock assessment for fishery management - using the FMSP Tools. FMSP Stock Assessment Tools Training Workshop Bangladesh 19 th - 25 th September 2005. Purpose of talk. To show where the FMSP Tools may be used in the process of fishery management

E N D
Stock assessment for fishery management - using the FMSP Tools FMSP Stock Assessment Tools Training Workshop Bangladesh 19th - 25th September 2005
Purpose of talk • To show where the FMSP Tools may be used in the process of fishery management • Complements Chapters 3-5 of FAO Fish. Tech. Pap. 487 Chapters 3-5
Content • The stock assessment process • Data collection for stock assessment • Estimating intermediate parameters • Estimating indicators • Estimating technical reference points • Risks of alternative reference points • Providing stock assessment advice to managers • ---------- • The FMSP Stock assessment tools • What do they estimate? • What can they provide advice on? • How do you select the best tool for the job?
The stock assessment process • Collecting fishery data • ( Estimating intermediary parameters ) • Estimating the current status of the fishery (indicators) • Estimating technical reference points • Providing management advice • Monitoring and feedback Chapter 3
Data / Inputs • Catch, effort and abundance data • Size compositions (catch at age and length frequency data) • Biological data (sex, size at maturity, etc) • Other data: Social, economic, indigenous knowledge, etc • Intermediate parameters • Used in models to estimate indicators and reference points, e.g.: • Individual fish growth rates (K, L∞) • Population growth rate and carrying capacity (K) • Natural mortality (M), maturity and reproduction (Lm50) • Gear selectivity (e.g. Lc50), Catchability (q) • Stock recruitment relationship • Assessment • tools • FMSP software • LFDA • Yield • CEDA • ParFish Other FMSP tools/guidelines • Age based methods • B&H invariant methods • Multi-species guidelines • Bayesian approaches • Empirical approaches • Other tools • FiSAT • VPA • BEAM4, etc • Fishery Indicators • Catch, effort (Cnow, fnow) • CPUE, Stock size (Bnow) • Fishing mortality rate (Fnow) • Others (social, economic, ecological, governance etc) • Reference Points • MSY-based (FMSY, BMSY) • Proxies for MSY (e.g. F0.1) • For maintaining reproductive capacity (e.g. F%SSB, F%SPR) • Risk-defined (e.g. Ftransient) • Multispecies and eco-system based • Economic and social • Management advice • Comparison of fishery indicators and reference points to provide management advice allowing for uncertainty and risk • Feedback for control rule management • Management projections (short-term and long-term advice) • Recognising multiple objectives and management options The Stock Assessment Process Figure 1.2
Data collection for stock assessment • Catch, effort and abundance (CPUE or survey-based) • Catch compositions (length and/or age frequencies -> F) • Other biological data (maturity, fecundity etc) • Section 3.2 focuses data needs for stock assessment (as above). See also below from FAO FAO. 1998. Guidelines for the routine collection of capture fishery data. Prepared at the FAO/DANIDA Expert Consultation. Bangkok, Thailand, 18-30 May 1998. FAO Fish. Tech. Pap. 382. Rome, FAO. 113pp. Stamatopoulos, C. 2002. Sample based fishery surveys. A technical handbook. FAO Fish. Tech. Pap. 425. Rome, FAO. 132pp. Section 3.2
Estimating intermediate parameters • Individual growth rates of fish (e.g. by LFDA) • Population growth rate and carrying capacity (e.g. CEDA) • Natural mortality rate (e.g. by Pauly equation) • Exploitation pattern / gear selectivity • Catchability (e.g. by CEDA) • Maturity and reproduction • Stock and recruitment (usually from VPA) • Not of direct value, but used as inputs to fishery assessments • Not constants, may vary over time (e.g. q, K etc) • Values will usually be uncertain, so use sensitivity tests Section 3.3
Estimating indicators • Catch (Grainger and Garcia method) • ------------------------------------------------------------------------------- • CPUE (approximate indicator of stock size) • ------------------------------------------------------------------------------- • Stock size (overall biomass by CEDA … • or stock size at age by VPA … • or relative abundance index by swept area survey) • ------------------------------------------------------------------------------- • Fishing mortality rate (F at age & year by VPA… • or equilibrium F by catch curves) • ------------------------------------------------------------------------------- • Other performance indicators • (e.g. % of mature fish in catch, others re objectives) Section 3.4
Estimating technical reference points (1/3) • MSY reference points (LRPs or TRPs) • FMSY, BMSY or the MSY catch (Yield, CEDA or PFSA) • Proxies for MSY reference points • e.g. Fmax, F0.1, where no SR data (from Yield or Gulland eqn) • Reference points for reproductive capacity (use as LRPs) • From a stock-recruitment plot: MBAL, BLOSS,Fmed etc • From a stock-recr. relationship: B50%R, Fcrash etc • From biomass per recruit: F20%SPR, F30%SPR (Yield) • From size limits based on size at maturity Section 3.5
Estimating technical reference points (2/3) • Risk defined reference points • Risk is inherently determined by: • selection of reference points (e.g. Fcrash is clearly a riskier reference point than FMSY), and • distance between Flim and Fpa (percentile point selected) (see next slide) • Set risk more explicitly using Yield’sFtransient point: F giving a specified probability (e.g. 10%) that the %SSB will fall below a specified level (e.g. 20% of unexploited level) during a forward projection (e.g. of 20 years) Section 3.5
Risks of alternative reference points Maximum Catch - FMSY Fcrash riskier Point at which species becomes extinct Size of Catch Amount of Fishing
Setting risk-based reference points Low risk Bpa at ~90th percentile of Blim distribution Blim (BMSY) Bpa (%ileBMSY)
Setting risk-based reference points Higher risk Bpa at ~75th percentile of Blim distribution Blim (BMSY) Bpa (%ileBMSY)
Estimating technical reference points (3/3) • Multi-species and ecosystem-based reference points • Focus on technical interactions and avoidance of bycatch and discarding problems etc • In CCAMLR, target fisheries may be closed if a bycatch limit is reached for a bycatch species • Economic and social reference points • E.g. MEY, indices of employment; income or profitability (resource rent); distribution of benefits (e.g. the percentage of the catch allocated to industrial and artisanal fisheries) • emphasises tradeoffs in objectives, e.g. between the catch rate and the total catch, and between the economic efficiency and employment. Section 3.5
Providing management advice • Annual feedback for ‘control rule’ management (where a full decision control system already in place and agreed) • Long-term decision analyses (every few years?) • Making projections: short-term and medium-term advice (emphasising the current state of the stock, and the likely time it will take to recover – see Yield and CEDA presentations) • Recognising multiple objectives and management options present as graphs or decision tables • Providing advice on uncertainty and risk • using sensitivity tests, • or by estimating risk-based reference points Section 3.6
A simple decision table format • Repeat table for each uncertainty or alternative ‘state of nature’ Indicators
Flow of information between managers and stock assessment advisors in developing and implementing a management plan • See also checklist of SA needs in new document
Options for alternative SA approaches • Following slides summarise Section 3.1 of FAO Document…
Deterministic or stochastic? • Deterministic models always give the same answer • Stochastic models allow for uncertainty in the inputs and estimate the uncertainty in the outputs…. • CEDA, Yield and PFSA software all give stochastic outputs Section 3.1.2
Biomass dynamic or analytical? • Biomass dynamic models like Schaefer surplus production model used in CEDA and PFSA • relate fishery outputs (catch) directly to inputs (effort) • Useful where fish are hard to age – used to set quotas and effort • Analytical models used in ‘Yield’ and other ‘per recruit’ and dynamic pool approaches • include intermediary processes, both biological and fishery (e.g. from LFDA) • may be length-based or age-based • Needed for management advice on size limits, seasons etc • Neither approach is more right or wrong than the other – they are just based on different models and assumptions Section 3.1.3
Equilibrium or dynamic? • Modern biomass dynamic fitting methods all use non-equilibrium dynamic approaches • Older methods (e.g. plotting CPUE vs f) would always enable some model to be fitted, due to correlation in variables, but often WRONG • Non-equilibrium methods will sometimes fail to find any reasonable solution, e.g. due to lack of contrast in data • Better to recognise limitations of data rather than use an incorrect equilibrium model Section 3.1.4
Age-based or length-based? • ELEFAN, FiSAT II etc largely promoted length-based methods for tropical fisheries. FMSP LFDA software also length-based • Four FMSP projects, however, have confirmed the benefits of age-based approaches, wherever fish can be aged (e.g. using otolith readings) – more accurate etc • Age-based methods now used for deep slope snapper fisheries in FMSP study sites in Seychelles • Length-based methods better where fish really can not be aged (e.g. crustacea), or where ageing is v. expensive Section 3.1.5, Chapter 10
‘per recruit’ or with recruitment? • Including recruitment in analytical models completely changes results • But stock-recruit relationship expensive to get • So, if using per-recruit models, give first priority to LRPs for biomass per recruit Section 3.2
The FMSP Stock Assessment Tools • Following FMSP outputs covered in FAO FTP 487 • LFDA software - estimating growth and mortality rates • Reference points from minimal population parameters • Yield software - estimating reference points for YPR etc • Management of multi-species fisheries • CEDA software - biomass dynamic / surplus production models • ParFish software - for data-limited situations & co-management • Empirical methods • Special approaches for inland fisheries Chapter 4 and Parts 2/3
Length frequency data Biological data, management controls (size limits, closed seasons etc) Data / inputs The analytical stock assessment approach using LFDA and Yield Assessment tools LFDA Yield Intermediate parameters L∞, K, t0 (growth) Indicators Z ( - M ) Fnow(Eq) Per recruit Fmax F0.1 F%SPR With SRR FMSY Ftransient Reference points Management advice Compare to make management advice on F e.g. if Fnow > FMSY, reduce F by management controls if Fnow < FMSY, OK Figure 4.1
Catch / effort time series Current catch / effort data Data / inputs The CEDA stock assessment approach (DRP / biomass dynamic model) Assessment tools CEDA Intermediate parameters r, K, q Bnow fnowCnow Indicators Reference points BMSY fMSY MSY Management advice Compare to make management advice on effort or catches Figure 4.5 Section 4.5
Catch / effort time series Stock assess’t interview data or other priors Preference interview data Current catch / effort data Data / inputs The ParFish stock assessment approach Assessment tools ParFish ParFish Intermediate parameters r, K, q Bnow fnowCnow Indicators Reference points flim Clim fopt Copt Management advice on effort or catch controls, in terms of limit and target levels. Targets (fopt,Copt) incorporate the preferences of resource users. Limits are based on the risk that B will be reduced below a specified % of K. Management advice Figure 4.10 Section 4.6
What do the different FMSP stock assessment tools estimate? (Table 5 of new guide)
Which tools can be used to provide advice for different management measures (Table 6 of new guide) See also Section 2.5.5 in FTP 487
How to select the best tool for the job? • Step 1. Decide the goals, objectives and standards first. • What tools could provide advice about the management controls and standards (indicators and reference points) selected for the fishery? • See Tables 5 and 6 of new SA guide • Note that several tools might be suitable, so... • Step 2. Of the tools and approaches available, what is the most appropriate to the local situation? • See ‘pros and cons’ tables to help decide • See also Box 13 and Table 9 of new guide for process….