Download
1 / 28
280 likes | 509 Views
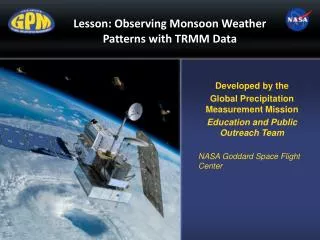
Developed by the Global Precipitation Measurement Mission Education and Public Outreach Team NASA Goddard Space Flight Center. Lesson: Observing Monsoon Weather Patterns with TRMM Data. Guiding Questions.

E N D
Developed by the Global Precipitation Measurement Mission Education and Public Outreach Team NASA Goddard Space Flight Center Lesson: Observing Monsoon Weather Patterns with TRMM Data
Guiding Questions Local Precipitation: How do we know if it’s raining? How do we know if it rained yesterday or will rain tomorrow? Global Precipitation: How do we know if it’s raining in other parts of the world? Where can we get that data? Satellites: How do satellites like TRMM measure precipitation? What else can they tell us? Precipitation Patterns: What are some patterns in the worldwide precipitation? What about patterns in smaller regions? Surface Temperature: How can looking at the Earth’s surface temperature help explain monsoon weather patterns?
Engage • How do you determine if it’s raining outside? • How do you know if it rained yesterday? If it will rain tomorrow? Images from Microsoft Office ClipArt, http://www.cocorahs.org/Content.aspx?page=measurerain, www.intellicast.com
Engage, cont. • What if we want to know if it has rained in other places in the world? • Where does weather data come from? Images from Microsoft Office ClipArt, http://trmm.gsfc.nasa.gov/images_dir/trmm_photos.html
Our focus today: satellite data, especially from the Tropical Rainfall Measuring Mission (TRMM) As you learn about the instruments on TRMM, note important details on your capture sheet. Image from http://trmm.gsfc.nasa.gov/images_dir/trmm_photos.html
Tracking Precipitation from Space • Satellites can provide a more complete picture of rain from space, allowing scientists to look at storms, rainfall totals, and changes throughout days to years • The Tropical Rainfall Measuring Mission (TRMM) has been providing rainfall data since 1998 in the tropics and mid latitudes • The Global Precipitation Measurement (GPM) Mission will extend observations of rain and snow up to the Arctic and Antarctic Circles
Instruments on TRMM • Visible and Infrared Scanner (VIRS) • Measuring infrared energy is measuring heat • The temperature of the clouds is related to their altitude, so you know how high they are • With VIRS, you see the top of the clouds only
Instruments on TRMM • TRMM Microwave Imager (TMI) • Can measure water vapor, cloud water and rainfall intensity • Kind of like an x-ray of a cloud – shows the precipitation inside, but it’s a flat image
Instruments on TRMM • Precipitation Radar (PR) • Show the 3-D structure of the clouds or a storm • Can see where the rain is heaviest • Only available over a narrow swath as TRMM passes over Hurricane Sandy on Oct. 28, two days prior to landfall
Instruments on TRMM The upper image shows the same 3-D view into Hurricane Sandy as the previous slide. (Click to go to an animation of the image). The lower image is microwave data showing rainfall totals, also for Sandy.
Instruments on TRMM • Lighting Imaging Sensor (LIS) • An optical camera that can see where lighting is occurring.
Global Precipitation Measurement (GPM) The GPM Core Observatory will provide improved measurements of precipitation from the tropics to higher latitudes GPM is an international mission which will use inputs from an international constellation of satellites to provide improved space and time coverage of precipitation (rain, snow) over the globe
Worldwide Precipitation Patterns • The images shows data combined from a number of sources (including TRMM) to get a worldwide view of monthly mean precipitation. Click on either image to go to an animation showing the whole year. What patterns do you notice in the data?
TRMM Precipitation Data – Eastern U.S. Let’s zoom in on a part of the world that may be familiar – the Eastern United States. Watch the animation and look for any seasonal patterns you see in the data.
Focus on Southeast Asia Now that we have something for comparison, let’s focus on one small area of the globe that has very interesting precipitation patterns: India. Image from http://earthobservatory.nasa.gov/Features/Monsoon/
TRMM Precipitation Data - India As you watch, look for any patterns in precipitation. When does it looks like different parts of India get the heaviest rainfall? Does all of the country get rain at the same time? Are there times when there is little to no rainfall in India?
What do we call this pattern of heavy precipitation during the summer months, and little to no precipitation during the rest of the year? A MONSOON!
And while rain can be fun (and be a welcome break from the heat . . .
Lots of rain all at once can cause heavy flooding as well. Mumbai, India Kashmor, Pakistan
Average Monsoon Onset for India Image from http://www.imd.gov.in/section/nhac/dynamic/Monsoon_frame.htm
What causes winds? We’ll look at some more satellite data about India shortly, but before that, just a reminder about what causes winds . . . When air is cooled, it sinks, causing high pressure. When air is heated, it rises, causing low pressure. AIR So winds blow from high to low pressure. AIR
Earth Surface Temperature for India Now let’s look at WHY India experiences a monsoon weather pattern. Keep the cause of wind in mind, as well as the fact that wind will pick up extra moisture when it blows across water. Here’s another animation of satellite data – this time of the Earth’s skin surface temperature. Make note of the patterns you observe.
Why do monsoons occur? NOVA: “Earth From Space” – Monitoring Earth’s Water Vapor
Why do monsoons occur? BBC: Monsoons Flood in Pakistan
Why do monsoons occur? Image source: http://www.geo.arizona.edu/Antevs/ecol438/monsoon.gif via http://www.nc-climate.ncsu.edu/edu/k12/.monsoons (also source of text) Monsoons are massive, seasonally changing sea breeze circulations that form due to temperature differences between land and ocean.
Evaluate • Explain what you’ve learned about monsoons! Write a well-written paragraph or two describing why India has the weather pattern it does. Be sure to include: • What the weather pattern is called (monsoon!) and what the weather would be like if you lived there • Why a monsoon weather pattern occurs (hint: be sure you talk about seasons and changes in temperature of the land and ocean) • The patterns you saw in the satellite data for precipitation and surface temperature over India, and how that relates to the reason for monsoons • How a satellite (especially TRMM) collects data and how that helps us understand monsoons
Stay Connected! • Follow us on Twitter: @NASA_Rain • “Like” us on Facebook: www.facebook.com/NASA.Rain • Precipitation Education Website: pmm.nasa.gov/education